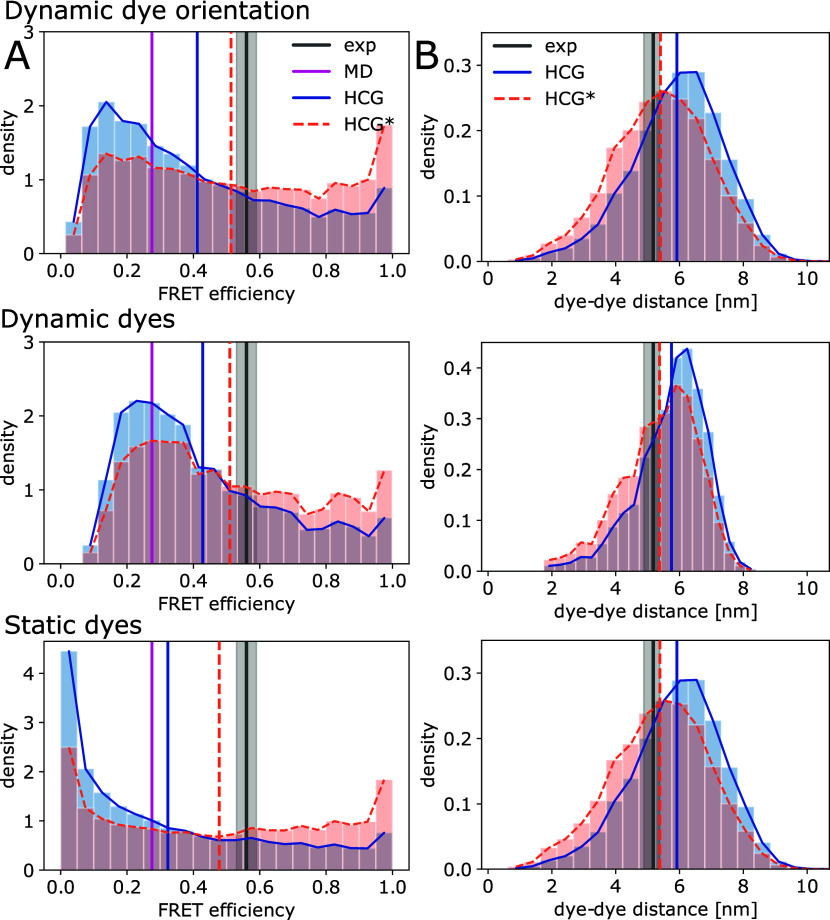
Figure 7.
HCG ensembles of rA19 compared to single-molecule FRET experiments. (A) Distribution of FRET efficiencies in the HCG ensemble (blue) and in the reweighted HCG* ensemble (orange) calculated with model 1 (top) with dynamic dye orientations and κ2 = 2/3, model 2 (middle) with dynamic dyes and κ2 = 2/3, and model 3 (bottom) with static dyes. For HCG*, we chose refined weights for θ = 40 (models 1 and 2) and θ = 60 (model 3). Vertical lines indicate the mean FRET efficiency measured in experiment (black, with gray shading indicating ± SEM), sampled in MD simulations of full-length rA19 with the same force field as used here to build fragment libraries21 (magenta), and calculated for the HCG (blue) and HCG* ensembles (orange). (B) Distributions of the interdye distance as determined for the HCG ensemble (blue) and the reweighted HCG* ensemble (orange) with models 1 (top), 2 (middle), and 3 (bottom). The mean distances for experiment (black), MD simulation (magenta), HCG (blue), and HCG* (orange) are shown as vertical solid and dotted lines. The experimental mean interdye distance was inferred from experimental single-molecule FRET efficiencies using a worm-like-chain model for the distance probability density function.21

