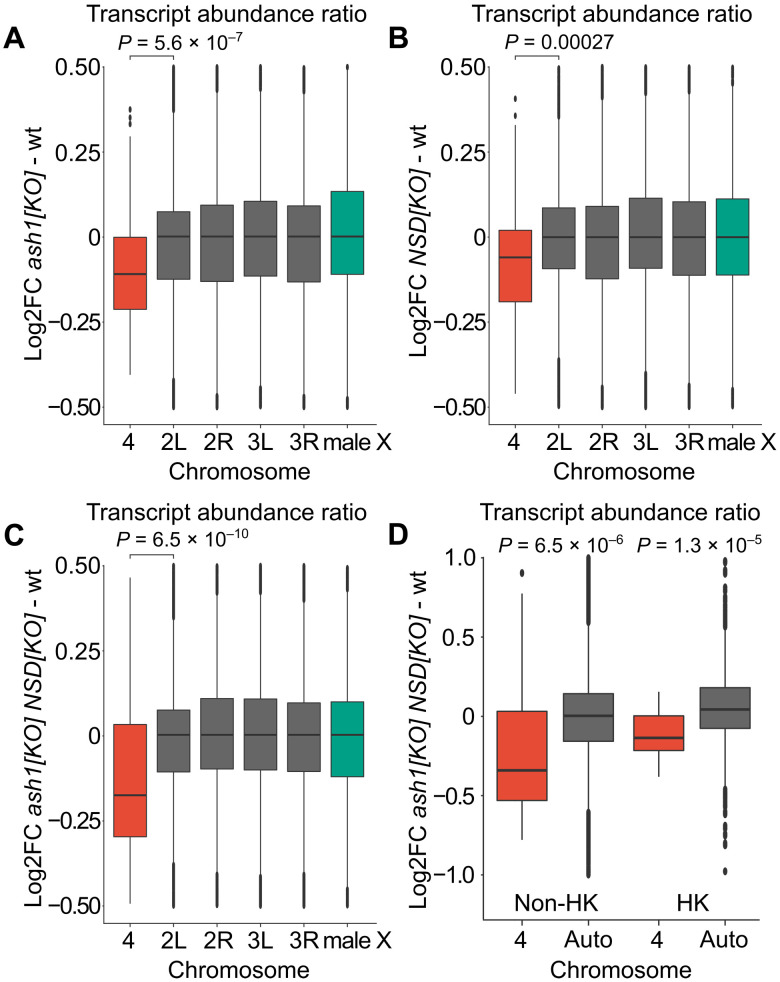
Fig. 4. Ash1 and NSD show additive effects and are required for balanced transcription output from genes on chromosome 4.
Box plots of chromosome-specific transcript abundance ratios (log2 fold change) compared to wild type for chromosome 4 (red), autosomes (gray), and the X chromosome (green). (A) In ash122/ash19011, the transcript abundance from chromosome 4 is reduced by 8.0% compared to the main autosome arms. (B) In NSDds46, the transcript abundance from chromosome 4 is reduced by 5.1% compared to the main autosome arms. (C) In ash122 NSDds46/ash19011 NSD ds46, transcript abundance is reduced by 14.9% compared to the main autosome arms. (D) Box plots showing chromosome 4 transcript abundance change in ash122 NSDds46/ash19011 NSD ds46 compared to wild type. The genes are grouped as non-housekeeping (left) and housekeeping genes (right). In ash122 NSDds46/ash19011 NSD ds46, the expression output is reduced by 21.2% in non-housekeeping genes, which is significantly greater than the 11.7% reduction observed in housekeeping genes. The statistical significances were determined by unpaired two-sample Wilcoxon tests. In (A) to (C), chromosome 4 is compared to chromosome arm 2L, and in (D), chromosome 4 is compared to all genes located on chromosomes 2 and 3.

