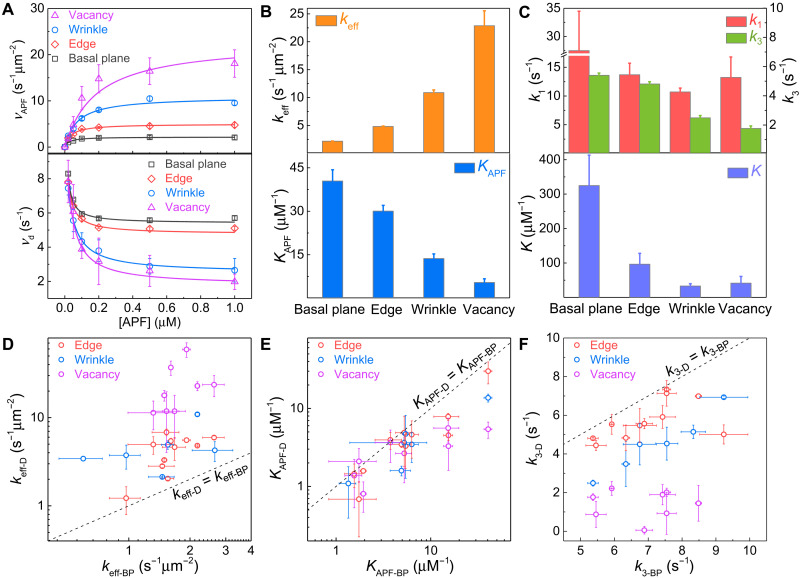
Fig. 2. Photocatalytic reaction kinetics at different structural features of InSe in Fig. 1.
(A) APF concentration dependence of APF reaction rate (vAPF) (top) and fluorescein dissociation rate (vd) (bottom). The error bars are the SDs in Gaussian fitting the distribution of catalytic reaction rates from many subregions (basal plane > 250, edge > 80, wrinkle > 30, and vacancy > 10). (B and C) Reaction rate constant keff [(B), top], adsorption equilibrium constant of APF KAPF [(B), bottom], direct and indirect desorption rate constants of fluorescein k1 and k3 [(C), top], and K [K = k2/(k−2 + k3)] [(C), bottom] at different structural features of InSe. The error bars were determined from fitting the kinetic data. (D to F) Comparison of keff (D), KAPF (E), and k3 (F) on the basal plane (keff-BP, KAPF-BP) and at defects (keff-D, KAPF-D) in same InSe flakes (n = 12). The error bars were determined from fitting the kinetic data.

