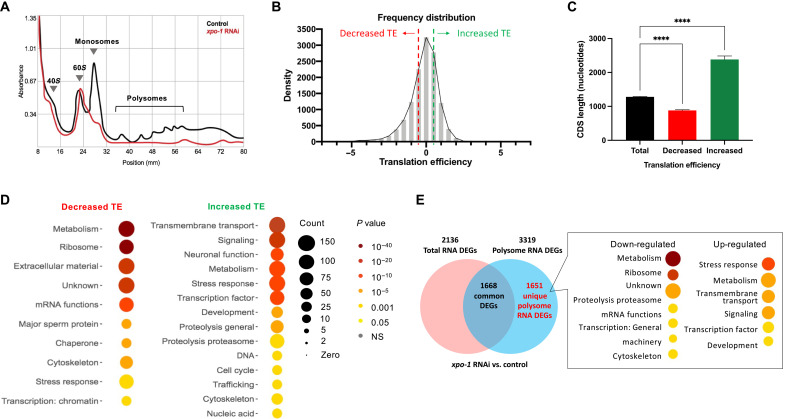
Fig. 2. xpo-1 silencing reduces global translation but enhances translation of a subset of mRNA.
(A) Representative polysome profiles of ribosomes extracted from control and xpo-1 RNAi nematodes after 96 hours on RNAi. (B) Histogram of genes with increased or decreased TE, calculated as log2 ratio of polysomal versus monosomal differences between xpo-1 RNAi and control; calculation method adapted from (69). See data file S3 for complete list of proteins with altered TE and fig. S2 for PCA and volcano plots. (C) CDS length of transcripts with decreased (n = 881) or increased (n = 692) TE compared to total transcripts (n = 12048) [mean ± SEM, analysis of variance (ANOVA), ****P < 0.0001]. (D) WormCat GO categories of proteins with altered TE from (B). (E) Venn diagram depicting common and unique polysome differentially expressed genes (DEGs) in xpo-1 RNAi compared to control and the WormCat GO categories represented by these unique DEGs. See data file S4 for complete list of unique polysome DEGs.

