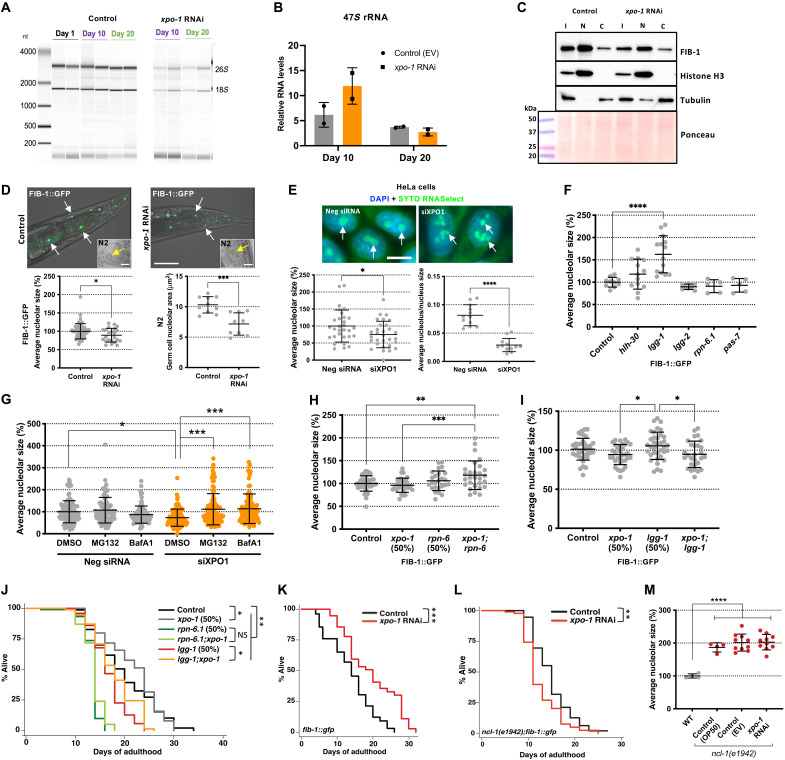
Fig. 3. xpo-1 life-span modulation links nucleolar dynamics to protein degradation systems.
(A) rRNA levels (biological duplicates) on days 1, 10, and 20. (B) Expression of 47S pre-rRNA from control and xpo-1 RNAi (biological duplicates). (C) FIB-1 protein levels in input (I), nuclear (N), and cytoplasmic (C) fractions after 96 hours of RNAi. Histone H3 and tubulin are markers for nuclear and cytoplasmic fractions, respectively. (D) Nucleoli (arrows) visualized by FIB-1::GFP and in germ cells in N2 (insets; scale bar, 5 μm) after 48 hours of RNAi (scale bar, 50 μm). Graphs represent average nucleolar size (% or μm2) from two to three independent experiments. (E) Nucleoli (arrows) in HeLa cells stained by SYTO RNASelect upon siRNA treatment for 48 hours. Graphs represent average nucleolar size (%) and nucleolar/nuclear size ratios from three independent experiments. (F) Average nucleolar size in FIB-1::GFP–expressing nematodes upon RNAi for autophagy and proteasomal genes for 48 hours. (G) Average nucleolar size in HeLa cells stained with SYTO RNASelect after treatment with siRNA for 48 hours along with MG132, bafilomycin A, or vehicle control dimethyl sulfoxide (DMSO). (H and I) Nucleolar size measurement with combined silencing of either xpo-1 and rpn-6.1 or xpo-1 and lgg-1 or 50% of individual RNAi in nematodes for 48 hours. (J) Life-span analyses in wild-type nematodes with xpo-1, rpn-6.1, and lgg-1 RNAi, alone or in combination with xpo-1. (K and L) Life-span analyses in fib-1::gfp (K) and ncl-1(e1942);fib-1::gfp (L) strains fed on control or xpo-1 RNAi bacteria. (M) Average nucleolar size in ncl-1(e1942);fib-1::gfp strain on RNAi or OP50 for 48 hours compared to wild-type fib-1::gfp strain on OP50 (n = 4 to 10 nematodes). Data are represented as means ± SD from three independent trials. *P < 0.05, **P < 0.01, ***P < 0.001, and ****P < 0.0001 by Student’s t test or ANOVA or Mantel-Cox log rank test for life-span analyses. See table S1 for life-span statistics and repeats. DAPI, 4′,6-diamidino-2-phenylindole.

