
Figure 3.
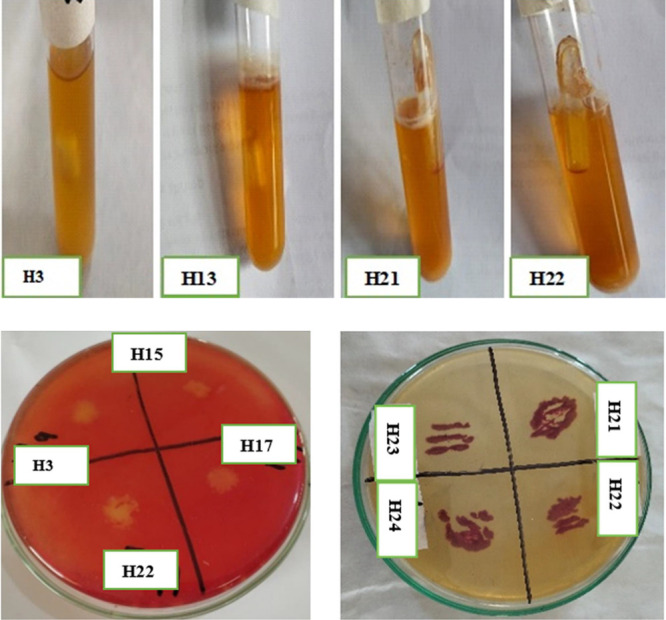
Bubble formation as observed in Durham tubes (upper row), clear zones by Congo red staining, and maroon color development with TTC (lower row) by different cellulolytic bacterial isolates (The photographs are original, unpublished and taken by the first author).