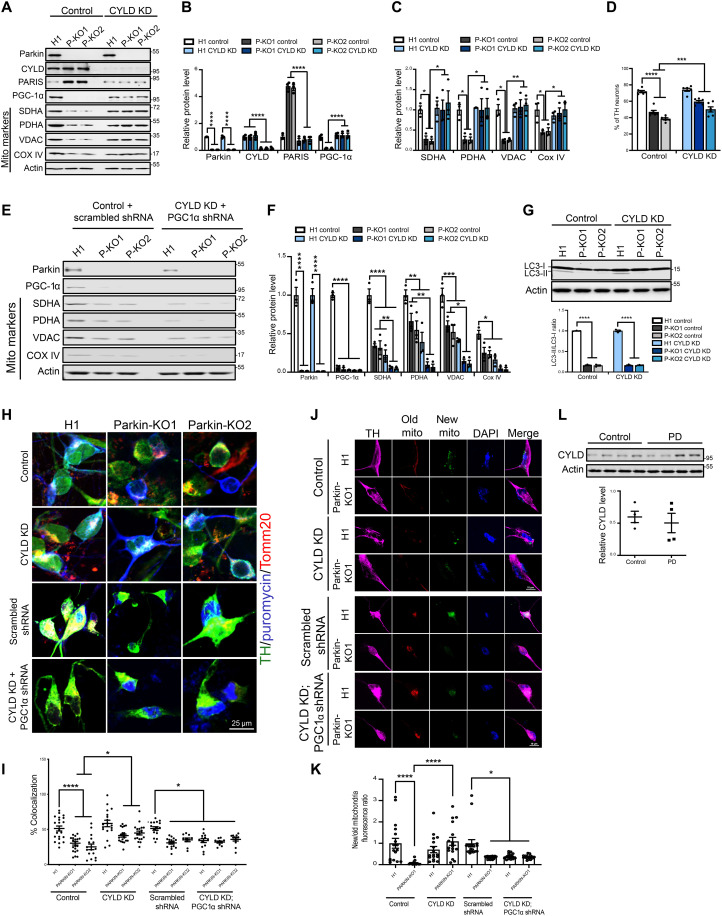
Fig. 7. CYLD down-regulation attenuates PARIS-mediated neurotoxicity in hES cell–derived midbrain dopamine neurons deficient for parkin activity.
(A) Immunoblot analysis of the indicated proteins in control (H1) and two independent parkin knockout (P-KO1 and P-KO2) human midbrain dopamine neurons. (B) Quantification of indicated proteins in the different conditions. Mean values from three independent experiments shown. (C) Quantification of indicated mitochondrial markers in the different conditions. N = 3 independent experiments. (D) Quantification of TH-positive dopamine neurons in differentiated human midbrain cultures immunostained with TH and neuronal TUJ1 marker. N = 6 independent experiments (E) Immunoblot analysis of mitochondrial biomarkers in indicated conditions. (F) Quantification of indicated proteins under respective conditions. N = 3 independent experiments. (G) Immunoblot analysis and quantification of LC3II/I ratio in differentiated human midbrain neurons. N = 3 independent experiments. (H) Representative confocal images of human midbrain dopamine neurons immunostained for TH (green) and puromycin. Puromycin-labeled mitochondrial proteins detected by colocalization of anti-puromycin immunofluorescence (magenta) with the mitochondrial marker Tomm20 (red). (I) Quantification of anti-puromycin colocalization with Tomm20 in TH-positive midbrain dopamine neurons. Mean values from at least 15 TH-positive midbrain dopamine neurons from three independent differentiation shown. (J) Representative confocal images of human midbrain dopamine neurons expressing SNAP-Tag-Cox8a fusion protein immunostained for TH (magenta). Existing mitochondrial pool (old mito) shown in red and mitochondria newly assembled (new mito) shown in green. Nucleus stained with 4′,6-diamidino-2-phenylindole (DAPI) (blue). (K) Ratio of newly assembled to old mitochondria in TH-positive midbrain dopamine neurons. Mean values from at least 15 TH-positive midbrain dopamine neurons from three independent differentiations shown. (L) Immunoblot analysis and quantification of CYLD expression in SN from postmortem PD and age-matched controls. N = 4 per group. Quantitative data = means ± SEM. One-way ANOVA; *P < 0.05, **P < 0.01, ***P < 0.001, and ****P < 0.0001.

