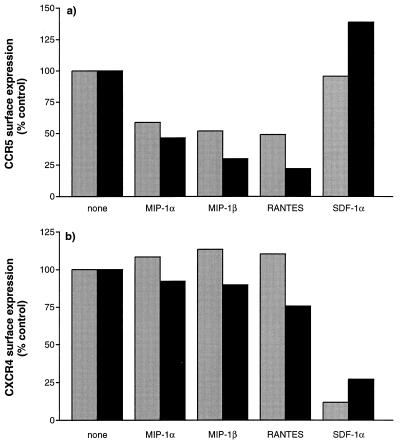
FIG. 6.
Surface expression of CCR5 and CXCR4 after exposure to CC and CXC chemokines. CD4+ T cells were treated for 2 h (gray bars) and 3 days (black bars) with CC or CXC chemokines (1 μg/ml) and the stained for surface expression of CCR5 (a) and CXCR4 (b) with MAbs 2D7 and 12G5, respectively. The median fluorescence intensities of the CCR5- and CXCR4-positive populations are shown as percentages of the levels for untreated control cells. The data shown were derived from one of two independent experiments on cells from two different donors.

