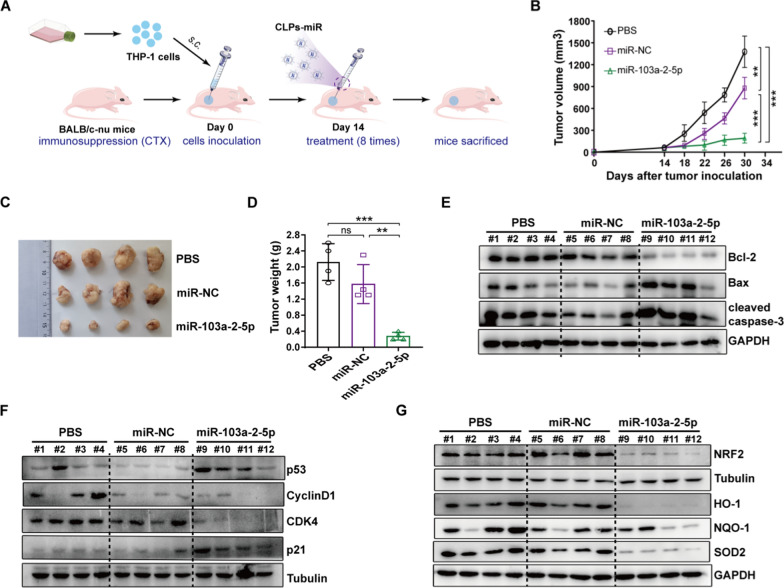
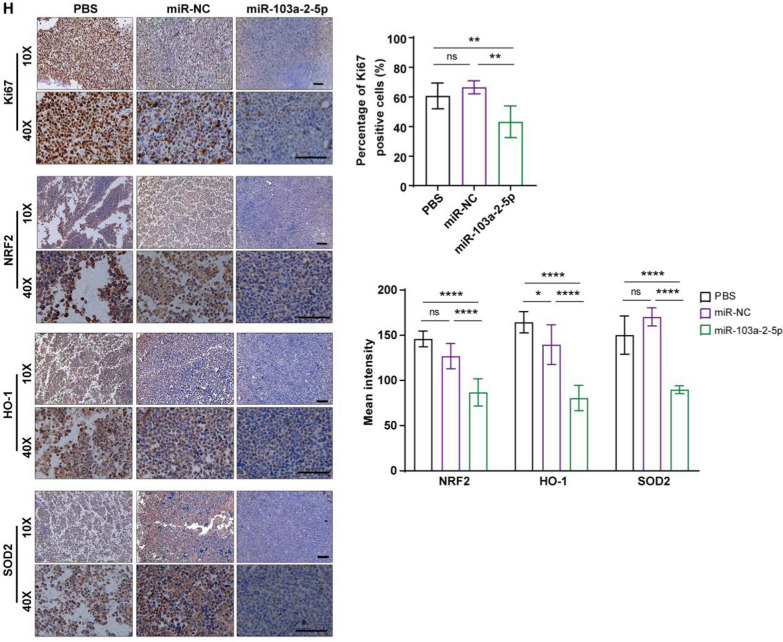
Fig. 8.
The antitumor activity in vivo. A Schematic illustrating the CLPs-miR treatment assays. THP-1 cells were implanted subcutaneously into BALB/c-nu mice (B) Growth record curves of subcutaneous tumors in nude mice during the experiment. C Representative photographs of subcutaneous tumors were harvested from all treatment groups. D Tumors harvested from nude mice were weighed. E, G The subcutaneous tumors of mice in all groups were removed and ground, and then western blot assays were used to detect the expression of the listed proteins. (H) Immunohistochemical analysis of Ki67, NRF2, HO-1, and SOD2. Scare bar: 100 µm. (n = 4; mean ± SD; One-way ANOVA), *P < 0.05, **P < 0.01, ***P < 0.001, ns: no significance, vs. control miRNA (miR-NC) and PBS


