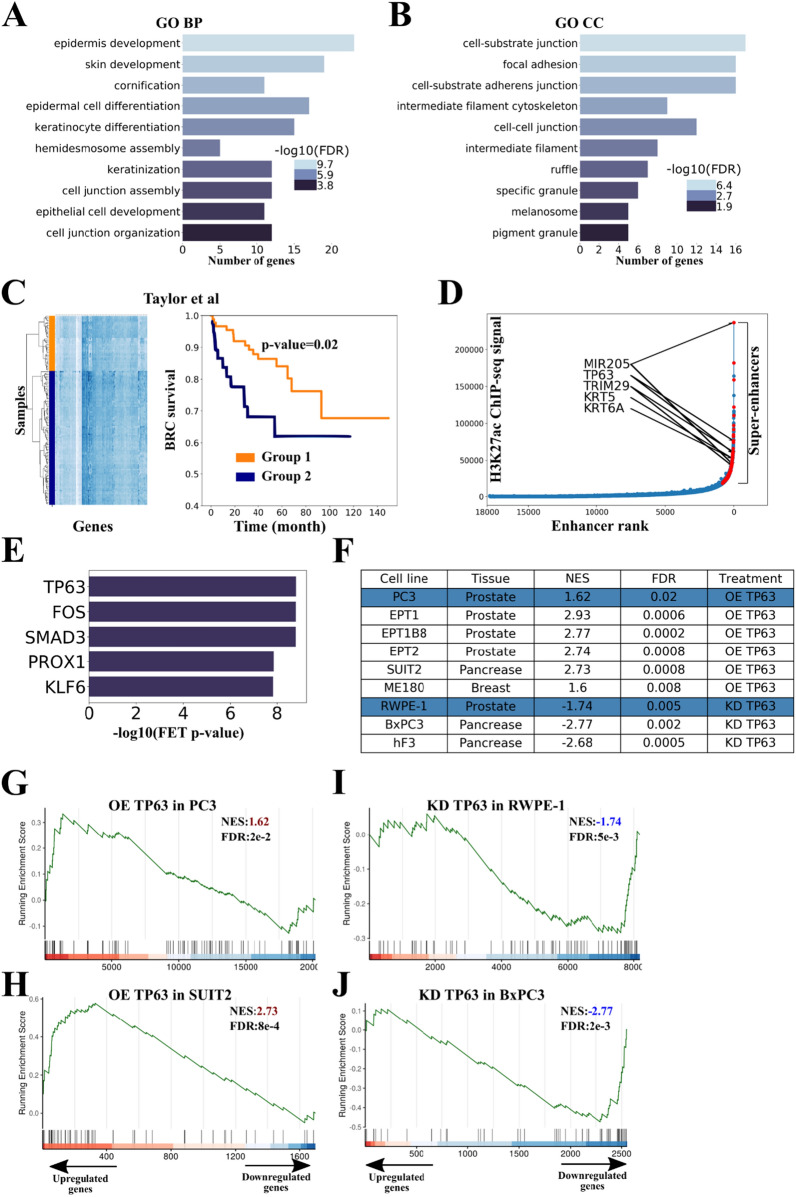
Fig. 2.
TP63 regulates the cluster of genes associated with epigenetic variability and genome instability in PRAD. A, B Gene Ontology (GO) analysis of the cluster genes. GO terms related to biological process (A), and cellular components (B) are shown. FDR is indicated with a color scale. C (Left panel) Hierarchical clustering of samples from the Taylor dataset [3] based on the expression of cluster genes revealed two distinct groups characterized by low (orange, group 1) and high (blue, group 2) mean expression of genes of TP63 cluster. The heatmap displays the expression levels of TP63 cluster genes. (Right panel) Biochemical recurrence-free (BRC) survival curves of the two patient groups (corresponding to hierarchical clustering of samples from the Taylor dataset, group 1 and group 2). The p value was calculated using the log-rank test. D Hockey stick plot based on input-normalized H3K27ac signals in PrEC cell line. Super-enhancer-associated cluster genes are highlighted with red. E Results of TF-enrichment analysis (CHEA3) for the cluster of interest. FET Fisher's exact test. F Table summarizing RNA-seq data evaluating the cluster genes signature upon TP63 overexpression (OE) or knockdown (KD) in the indicated cell lines. Normalized enrichment score (NES) was calculated using the GSEA function from clusterProfiler package [29]. Blue rows indicate data from this study. G, H Gene set enrichment analysis (GSEA) plots evaluating the cluster genes signature upon TP63 overexpression (OE) in PC3 (PRAD, G) and SUIT2 (GSE115462, pancreatic cancer, H). NES Normalized enrichment scores. I, J GSEA plots evaluating the cluster genes signature upon TP63 knockdown (KD) in RWPE-1 (prostate basal epithelium, I) and BxPC3 (GSE115462, pancreatic cancer, J)

