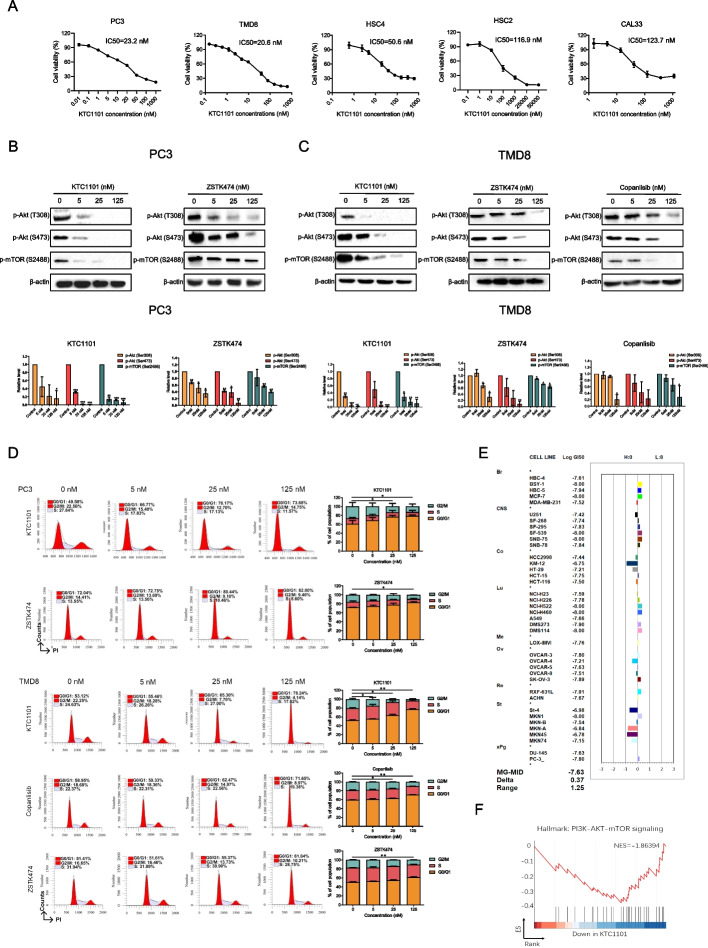
Fig. 2.
In vitro anti-tumor efficacy of KTC1101. A Cell viability assays illustrating KTC1101's anti-proliferative activity against various cancer cell lines after 48-h treatment with incremental concentrations of KTC1101. B, C The phosphorylation status of Akt and mTOR in PC3 and TMD8 cell lines was analyzed by Western blot after 48-h treatment with increasing concentrations of KTC1101, compared to other pan-PI3K inhibitors ZSTK474 and Copanlisib. D Analysis of cell cycle distribution in PC3 and TMD8 cell lines after 48-h treatment with increasing concentrations of KTC1101 or other pan-PI3K inhibitors ZSTK474 and Copanlisib, using propidium iodide (PI) staining. E Validation of KTC1101’s inhibitory efficacy across a range of cell lines using the JFCR39 analysis. Cell growth was measured using sulforhodamine B assay. The concentration of KTC1101 that inhibited 50% of cell growth (GI50) was calculated. The deviation of log GI50 for each cell line from the average log GI50 across the JFCR39 panel was plotted as a fingerprint. MG-MID (mean of Log GI50 values) represents the average log GI50 for all 39 cell lines. F PC3 cells were treated with 25 nM KTC1101 or vehicle for 48 h. Gene Set Enrichment Analysis (GSEA) depicting alterations in the "PI3K-AKT-mTOR signaling" pathway due to KTC1101 treatment. Graphs are presented as the mean ± SEM from three independent experiments; p-values were determined using a two-tailed unpaired Student’s t-test; *p < 0.05; **p < 0.01; ***p < 0.001

