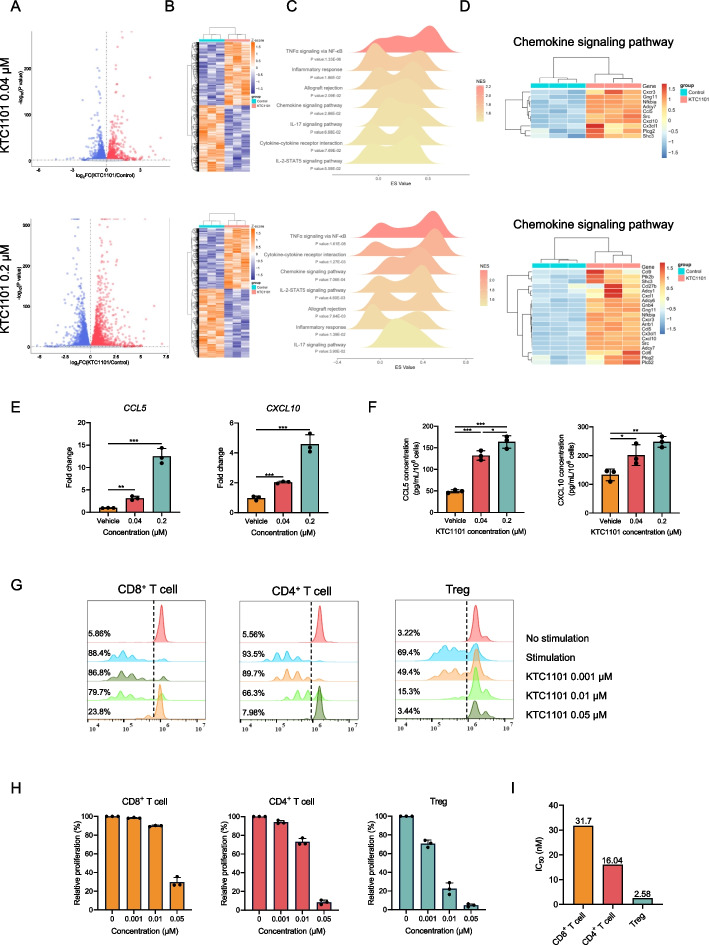
Fig. 5.
KTC1101's impact on tumor immunity and T-cell response. A A volcano plot depicting overall gene expression alterations in B16 cells post 48-h treatment with KTC1101 or vehicle. The plot includes log fold-change values and p-values, with a horizontal dashed line signifying a p-value threshold 0.05. B A heatmap representing the differentially expressed genes. C Ridgeline plot illustrating the enrichment of differentially expressed genes in specific KEGG and Hallmark pathways, including term names, p-values, and enrichment scores, with normalized enrichment scores represented as color variations. D Heatmap of genes in the "Chemokine signaling pathway". E An RT-PCR analysis showing the relative expression of crucial chemokines, CCL5 and CXCL10, in B16 cells following a 48-h treatment with KTC1101. F ELISA quantification of CCL5 and CXCL10 secretion levels in the supernatant of B16 cell cultures treated with KTC1101 for 48 h. G Flow cytometry-based analysis depicting the proliferation of CD8+ T cells, CD4+ T cells, and Tregs in the presence of KTC1101 for 72 h, with representative histograms and percentage of dividing cell populations. CD8+ T cells, CD4+ T cells, and Tregs from the spleen of WT mice were sorted by FACS. H The differential inhibitory effects of KTC1101 on T cells. I IC50 values for KTC1101’s effect on different T cell populations. Graphs are presented as the mean ± SEM from three independent experiments; p-values were determined using a two-tailed unpaired Student’s t-test; *p < 0.05; **p < 0.01; ***p < 0.001

