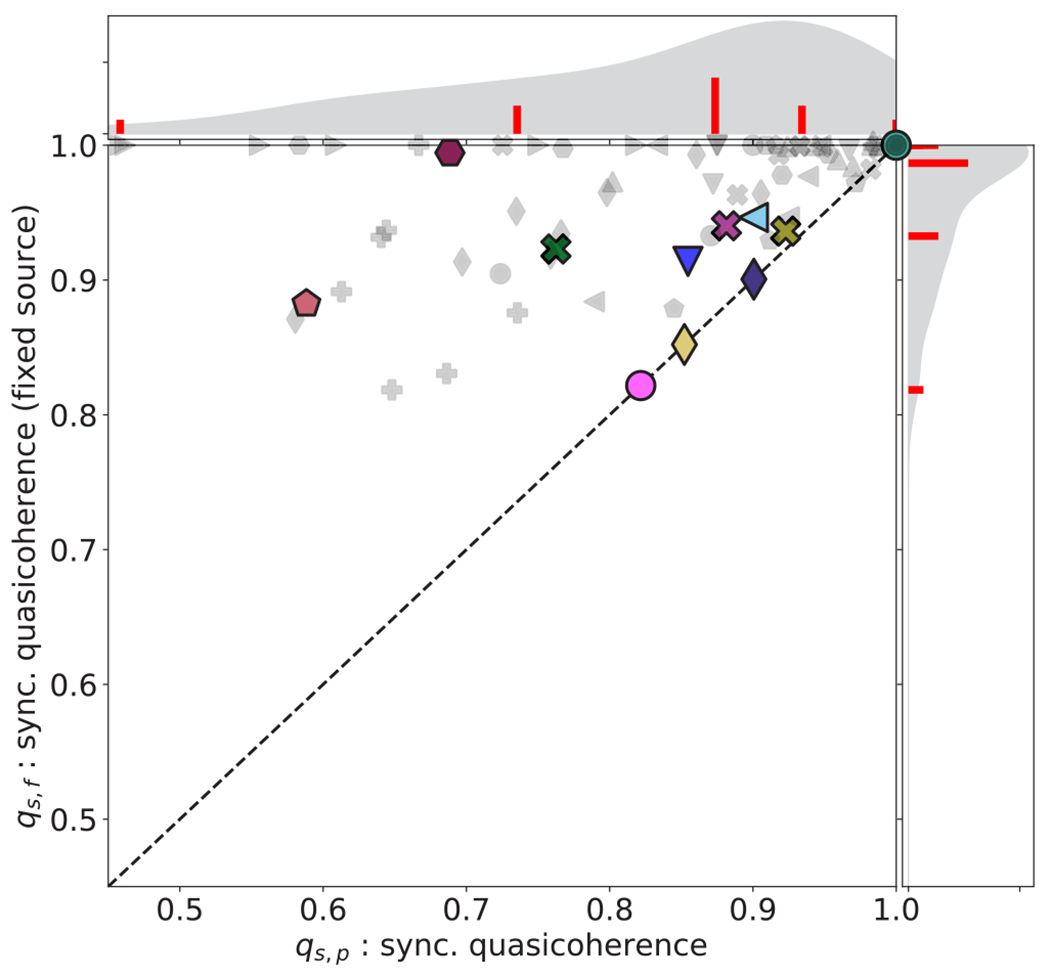
FIG. 5.

Scatterplot of the synchronous quasicoherences of the Cell Collective models when source nodes are (x axis) or are not (y axis) candidates for perturbation (the asynchronous distribution is available in Fig. 17 of Appendix F). When the values of source nodes are fixed, the quasicoherence values are tightly clustered around 1, indicating a high degree of phenotypic robustness. The symbols indicate the model categories and highlighted models as defined in Fig. 1.
