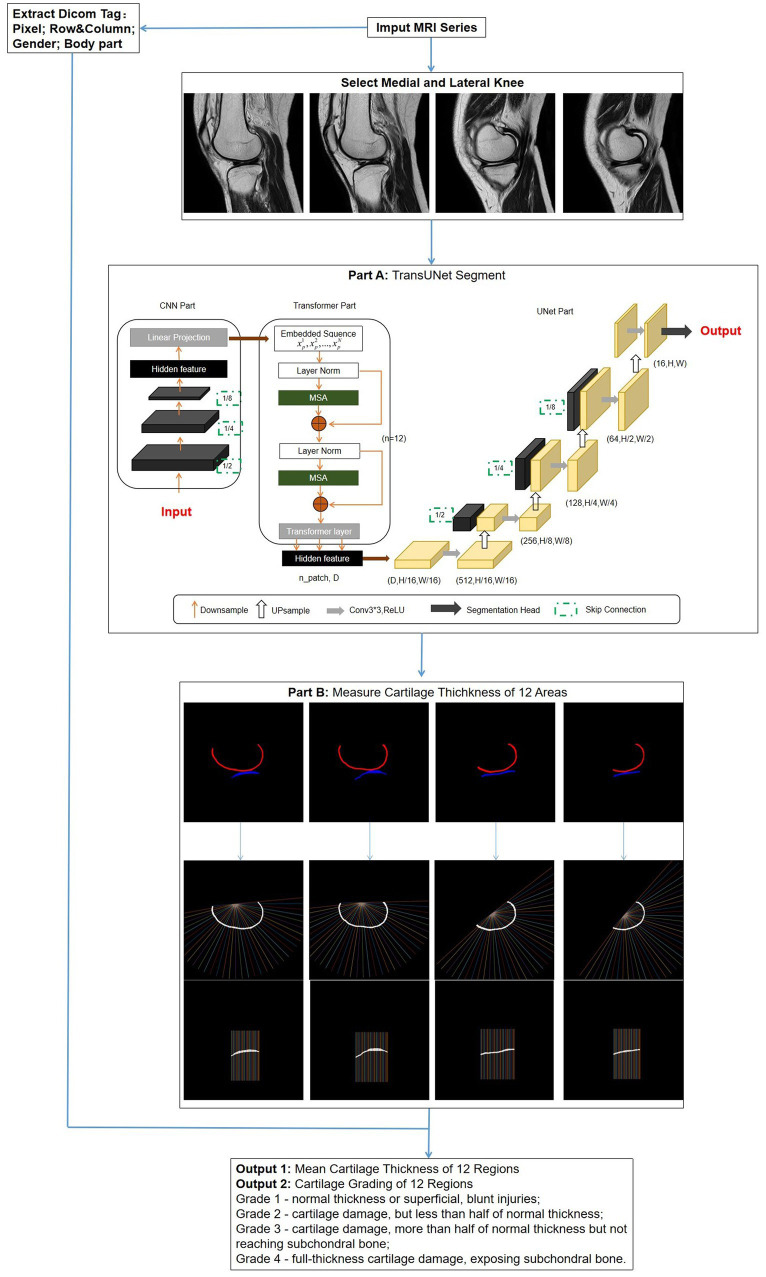
Figure 3.
Overall flowchart of the research model. After the images are selected, a network is used to segment the regions of cartilage. Subsequently, the segmentation results are automatically measured for thickness and graded. Simultaneously, DICOM tag information is extracted for obtaining standard knee joint cartilage thickness. Part A: The structure of TransUNet, which achieved the best results of all network models; Part B: measurement method of cartilage thickness; vertical lines 1–12 intersecting with cartilage represent FMA and FLA; lines 13–24 represent FMC and FLC; and lines 25–36 represent FMP and FLP.

