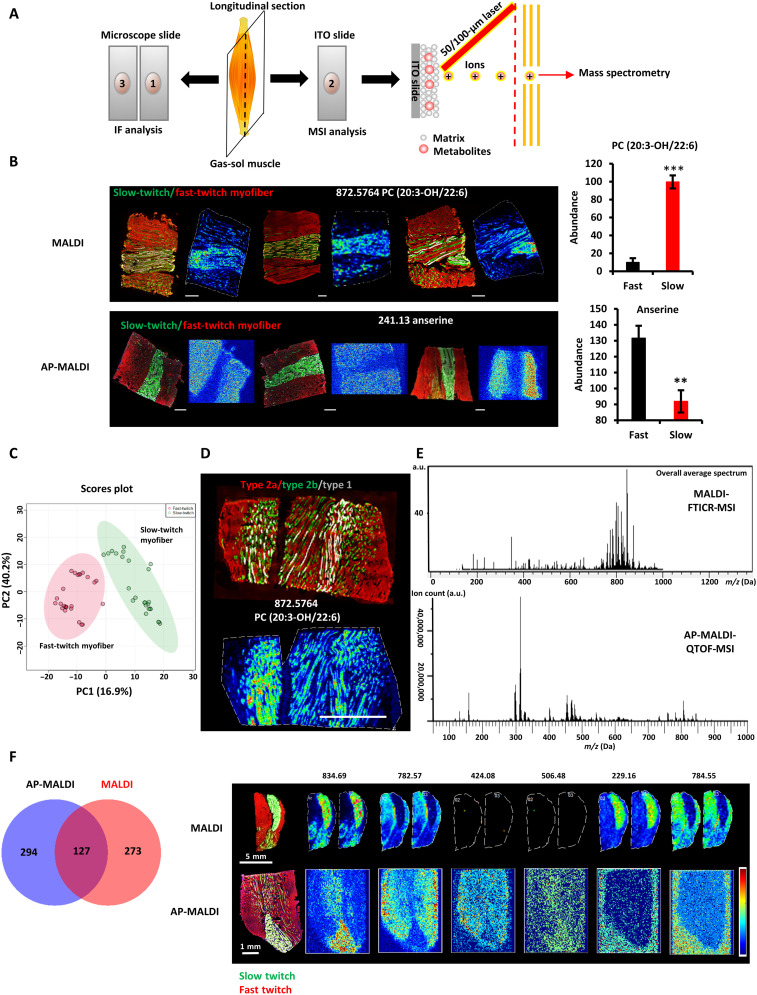
Fig. 1. Reproducibility of metabolomic fingerprints of slow- and fast-twitch myofibers in MSI.
(A) Schematic of the MSI workflow. Every three consecutive sections from the muscle were prepared as a group, with the first and third sections used for immunofluorescence (IF) analysis and the middle sections used for MSI analysis. (B) Fingerprint metabolites of slow- and fast-twitch myofibers detected by AP-MALDI-QTOF and MALDI-FTICR (left). Multicolor immunofluorescence staining of the GAS-SOL muscle (right). Means ± SEM; N = 3; **P < 0.01 and ***P < 0.001 compared with fast-twitch myofibers; Student’s t test. Green, slow twitch; red, fast twitch. Scale bars, 500 μm. (C) PLS-DA of the fast-twitch myofibers and the slow-twitch myofibers (N = 24 independent MSI experiments). (D) Performance of single-cell MSI on myofibers at the high spatial resolution of 25 μm. Immunofluorescence staining (top) and MSI analysis (bottom) of adjacent longitudinal sections of the hindlimb’s GAS-SOL muscle. Green, type 2a myofiber; red, type 2b myofiber; white, type 1 myofiber. Scale bar, 1000 μm. (E) Averaged mass spectrum from MALDI (top) and AP-MALDI (bottom) of the GAS-SOL muscle.ITO, indium tin oxide; a.u., arbitrary units. (F) Root mean square–normalized abundance and distributions of discriminative peaks (table S1) in slow- and fast-twitch myofibers according to MALDI- and AP-MALDI-MSI of GAS-SOL muscle (left). Fingerprint metabolites of slow- and fast-twitch myofibers detected by AP-MALDI-QTOF and MALDI-FTICR. Immunofluorescence staining and MSI of adjacent longitudinal sections of the hindlimb’s GAS-SOL muscle (right). Green, slow twitch; red, fast twitch.

