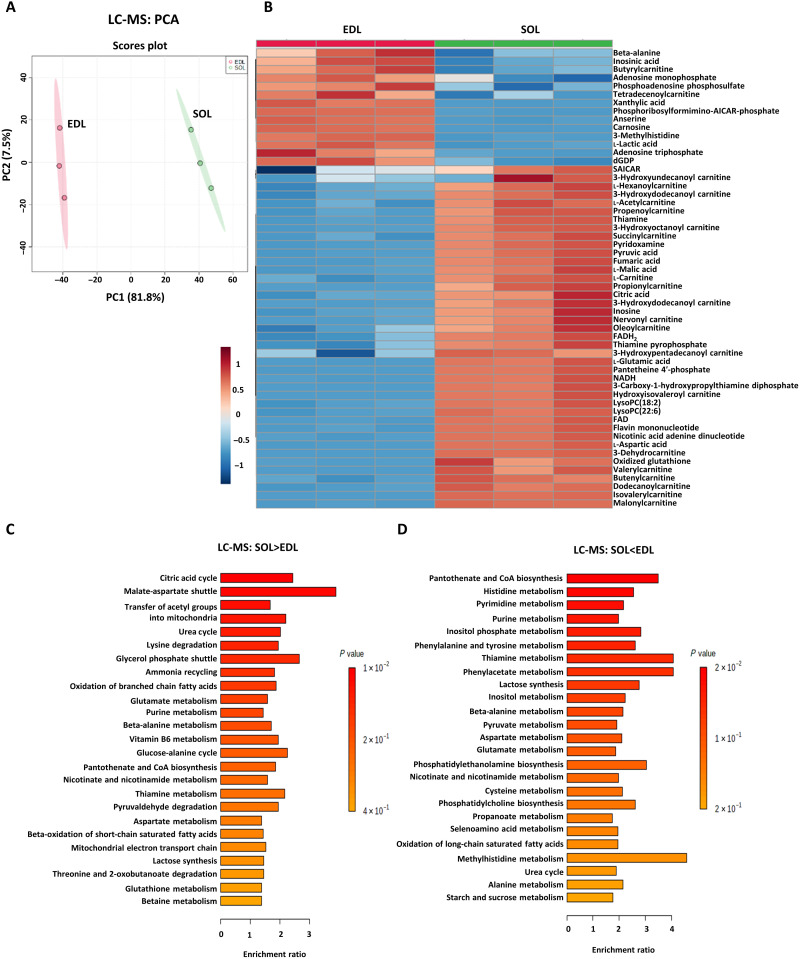
Fig. 2. LC-MS metabolomic analysis of slow- and fast-twitch myofibers.
(A) PCA of the fast-twitch EDL and the slow-twitch soleus (SOL) muscles from different animals (N = 3). The two PCs explaining the largest parts of the data variation are shown. (B) Heatmap of differential metabolites (P < 0.05, N = 3, Student’s t test). Heatmap denotes the metabolite signal intensities of each sample, showing significantly altered metabolites that increased and decreased in the EDL, relative to the SOL muscle. (C and D) Metabolite set enrichment analysis (MSEA) of differentially abundant metabolites in EDL and SOL muscles based on LC-MS data. (C) MSEA of significantly up-regulated metabolites in SOL muscles. Citric acid cycle: P = 0.012, N = 3; malate-aspartate shuttle: P = 0.014, N = 3. (D) MSEA of significantly up-regulated metabolites in EDL muscles. Pantothenate and coenzyme A (CoA) biosynthesis: P = 0.024, N = 3; histidine metabolism: P = 0.026, N = 3; pyrimidine metabolism: P = 0.037, N = 3; purine metabolism: P = 0.042, N = 3; inositol phosphate metabolism: P = 0.049, N = 3. Bonferroni-corrected P values were calculated using the Quantitative Enrichment Analysis (QEA) module of MetaboAnalyst MSEA based on the globaltest algorithm and a generalized linear model to estimate the Q-stat for each metabolite set.

