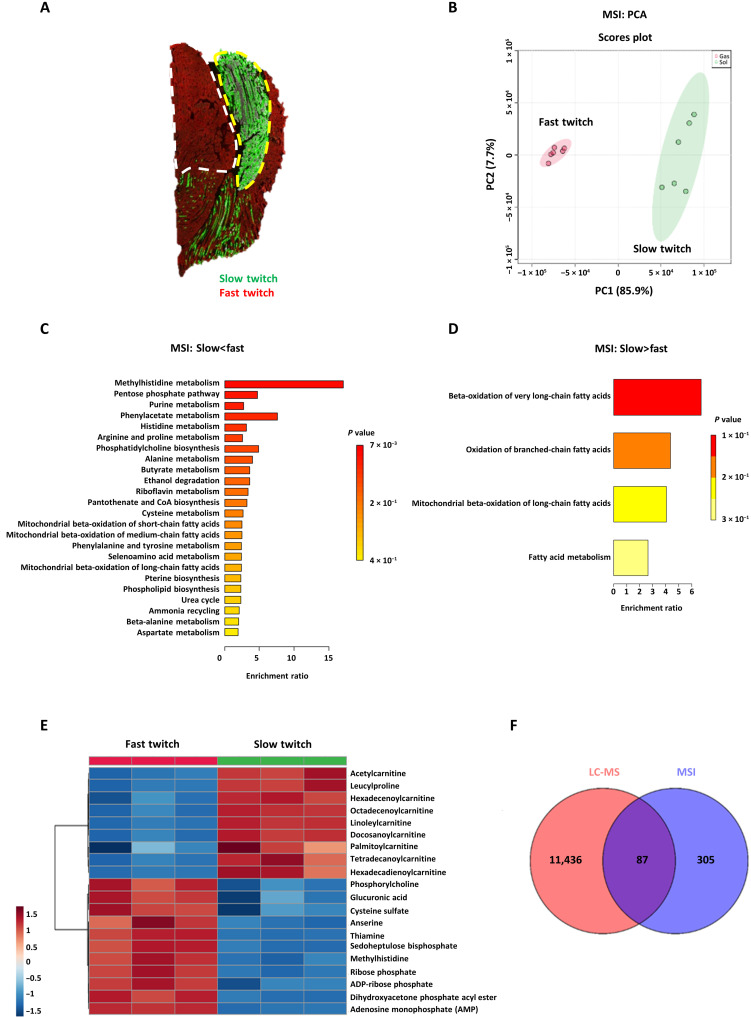
Fig. 3. Automated MSI analysis of metabolic patterns in slow- and fast-twitch myofibers.
(A) Representative immunofluorescence images. Immunofluorescence staining of slow- and fast-twitch myofibers in the GAS-SOLmuscles. Red, fast-twitch myofibers; green, slow-twitch myofibers; white dotted line, ROI with fast-twitch myofibers; yellow dotted line, ROI with slow-twitch myofibers. (B) PCA of slow-twitch (green) and fast-twitch (red) myofiber regions (N = 6 each) based on MSI data. (C and D) MSEA of differentially abundant metabolites in slow- and fast-twitch myofibers based on MSI data. (C) MSEA of up-regulated metabolites in fast-twitch myofibers. Methylhistidine metabolism: P = 0.057, N = 6; PPP: P = 0.065, N = 6; purine metabolism: P = 0.088, N = 6. (D) MSEA of up-regulated metabolites in slow-twitch myofibers, beta-oxidation of very long-chain fatty acids: P = 0.14, N = 6. Bonferroni-corrected P values (cutoff P < 0.15) were calculated using the QEA module of MetaboAnalyst MSEA, based on the globaltest algorithm and a generalized linear model to estimate the Q-stat for each metabolite set. (E) Heatmap of differential metabolites (P < 0.05, N = 3, Student’s t test). The heatmap denotes the metabolite signal intensities of each sample, showing significantly altered metabolites that increased and decreased in the fast-twitch myofibers, compared with the slow-twitch myofibers. (F) Venn diagram analysis to compare the degree of overlap between LC-MS and MSI data.

