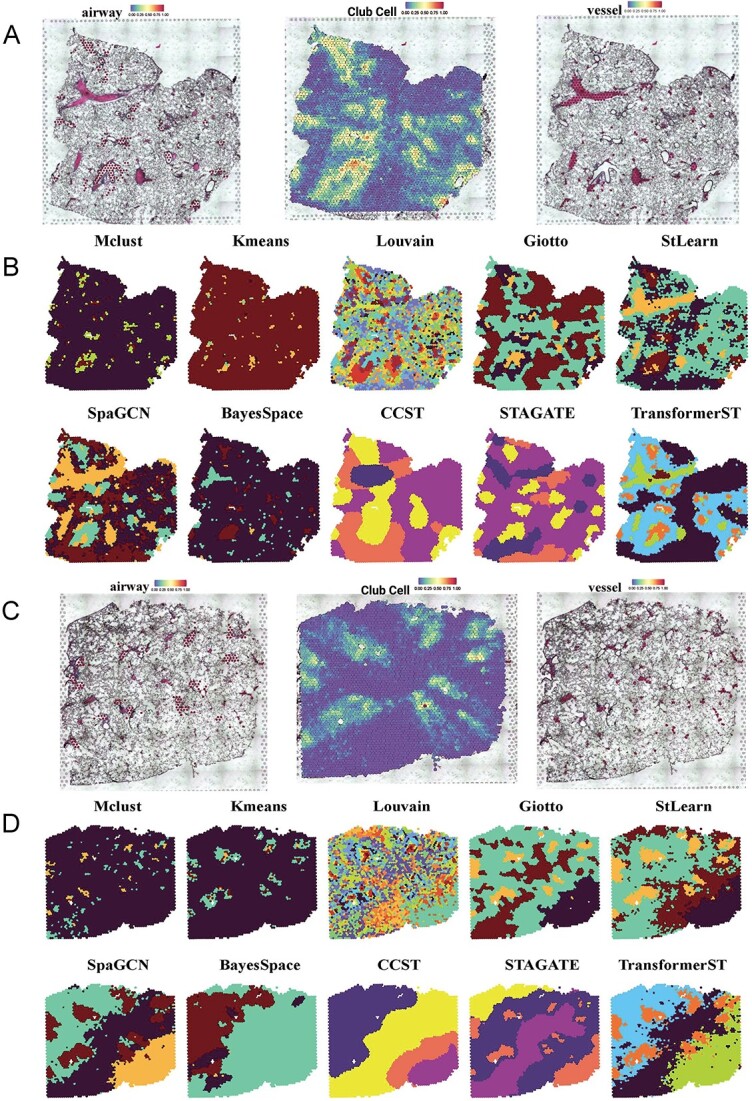
Figure 3.

Tissue identification in mouse lung Visium data at spot resolution. A, Manual annotations of airways (left) and blood vessels (right) of the first slice. Pathologists identified regions of significant regions according to the histology image. Airways were defined in line with the proportion of club cells (middle) within each slice. B, Tissue types assignments by different spatial clustering methods for the first sample. C, Manual annotations of airways (left) and blood vessels (right) of the second slice. D, Tissue types assignments by different spatial clustering methods for the second sample.
