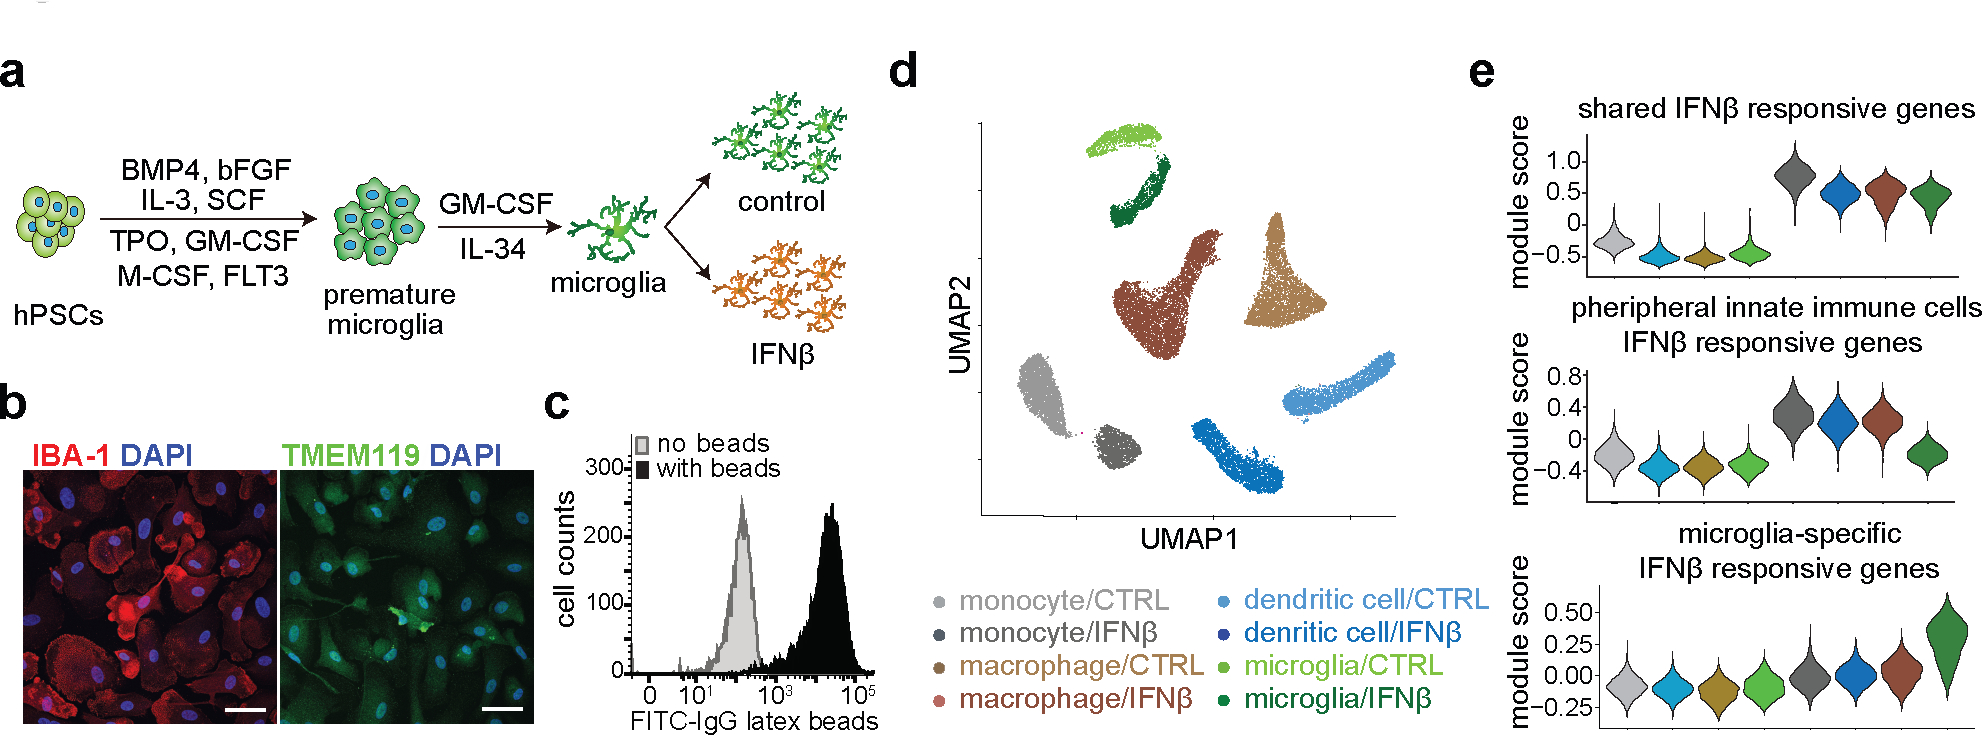
Figure 1. Characterize differentiated microglia.

a, Schematic workflow of microglia differentiation and maturation using growth factors. b, Representative immunofluorescence staining of microglia-specific markers IBA-1 and TMEM119 from 3 independent differentiations. The white bars at the lower right corner represent 20 μm. c, FACS analysis of phagocytosis capacity of differentiated microglia with fluorescein-labeled rabbit IgG-coated latex beads. d, scRNA-seq UMAP visualization of cells from four distinct immune cell types including iPSC-derived microglia-like cells, in response to IFNß stimulation. Multiplexed single cell gene expression analysis using the 10X platform identifies eight major cell clusters corresponding to cell types and IFNß treatment conditions. e, Gene expression analysis reveals gene groups responding differentially to IFNß stimulation between peripheral myeloid cells and microglia.
