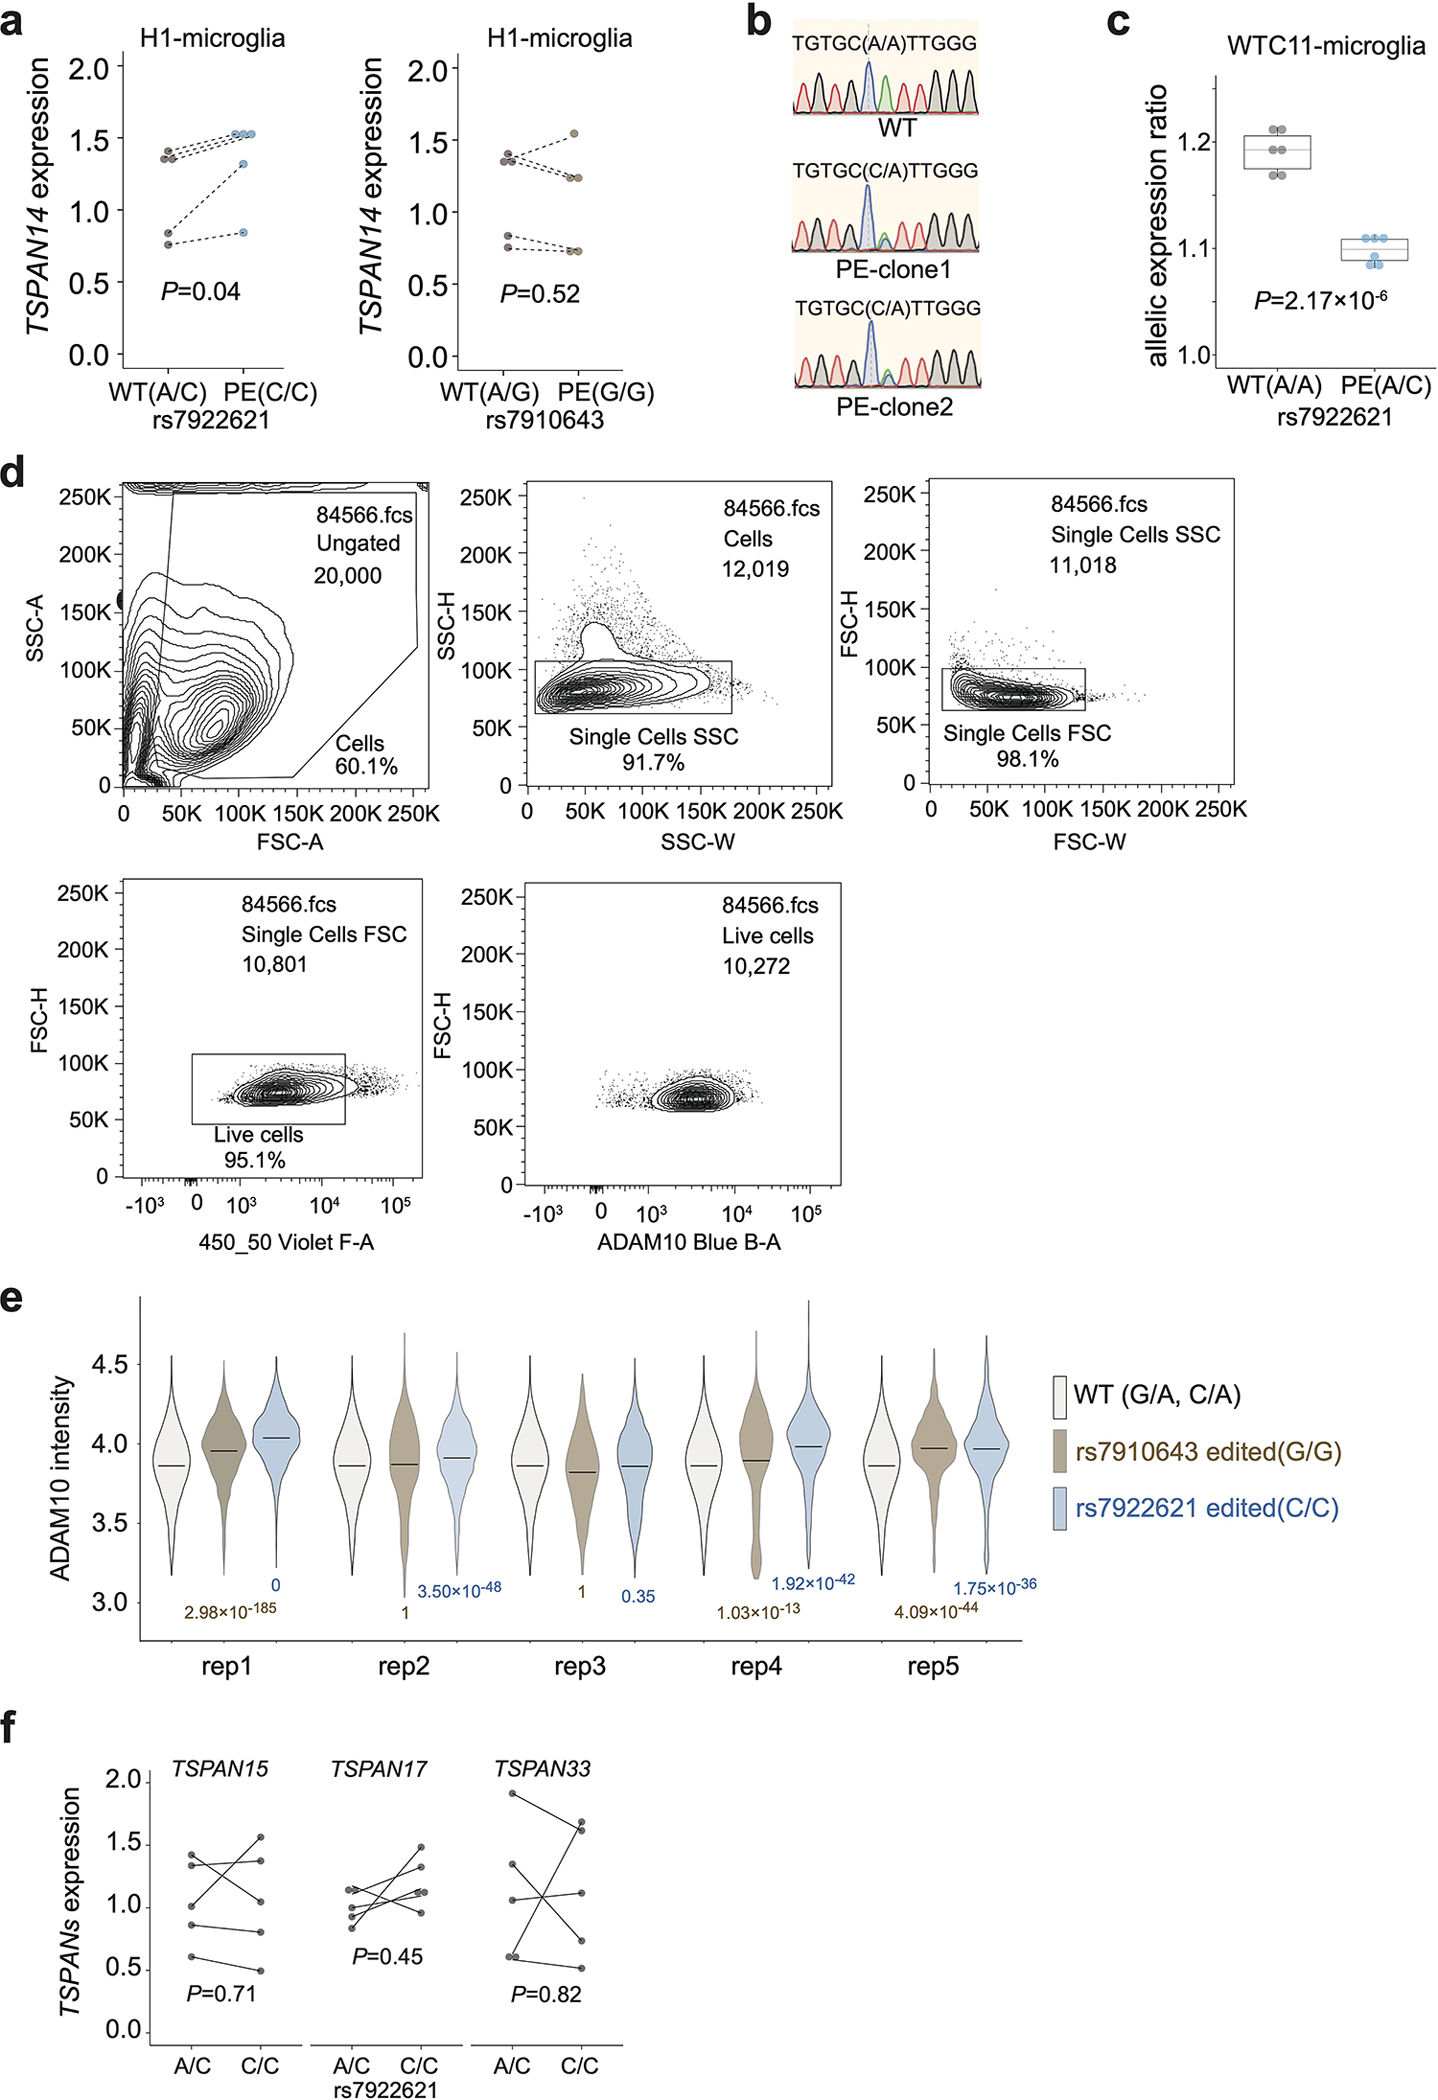
Extended Data Fig. 8. Validation of prioritized AD variants by allelic analysis.

a, The total expression levels of TSPAN14 are elevated in microglia-like cells derived from H1 with prime editing rs7922621 (A/C to C/C), but not in microglia with prime editing at rs7910643 (A/G to G/G). P values are calculated with two-sided paired t-test (dash line indicating the pairing within each differentiation batch, n = 5). Each dot represents one biological replicate. b, Representative results from sanger sequencing display WTC11 rs7922621 wildtype (A/A) and KI clones (A/C). c. The ratios of allelic expression of TSPAN14 decrease in microglia-like cells derived from KI clones (rs7922621, A/C) compared to those derived from wildtype clones rs7922621 (A/A). P values calculated using two-sided two-sample t-test (n = 6). Boxplots indicate the median and interquartile range. Whiskers mark the 5th and 95th percentiles. d, Representative contour plots of ADAM10 FACS gating strategy. Cells were separated from debris based on the forward scatter area and side scatter area. Two singlet gates were applied using the width and height metrics of the side scatter and forward scatter. Live cells are selected based on SYTOX Blue signal and ADAM10 signals are shown for all live singlets. e, Violin plot of log10(ADAM10 intensity) in flow cytometry for WT controls, rs7922621 (G/G) edited cells, rs7910643 (C/C) edited cells across all replicates. P values are calculated using one-sided two-sample Wilcoxon test on ADAM10 levels for all cells compared to WT control within each replicate (n = 5). The horizontal line indicates the median. f, RT-qPCR experiments show that editing rs7922621 from A/C to C/C does not affect the expression levels of TSPAN15, TSPAN17, or TSPAN33 in microglia. P values are calculated with two-sided paired t-test (dash line indicating the pairing within each differentiation batch, n = 5). Each dot represents one biological replicate.
