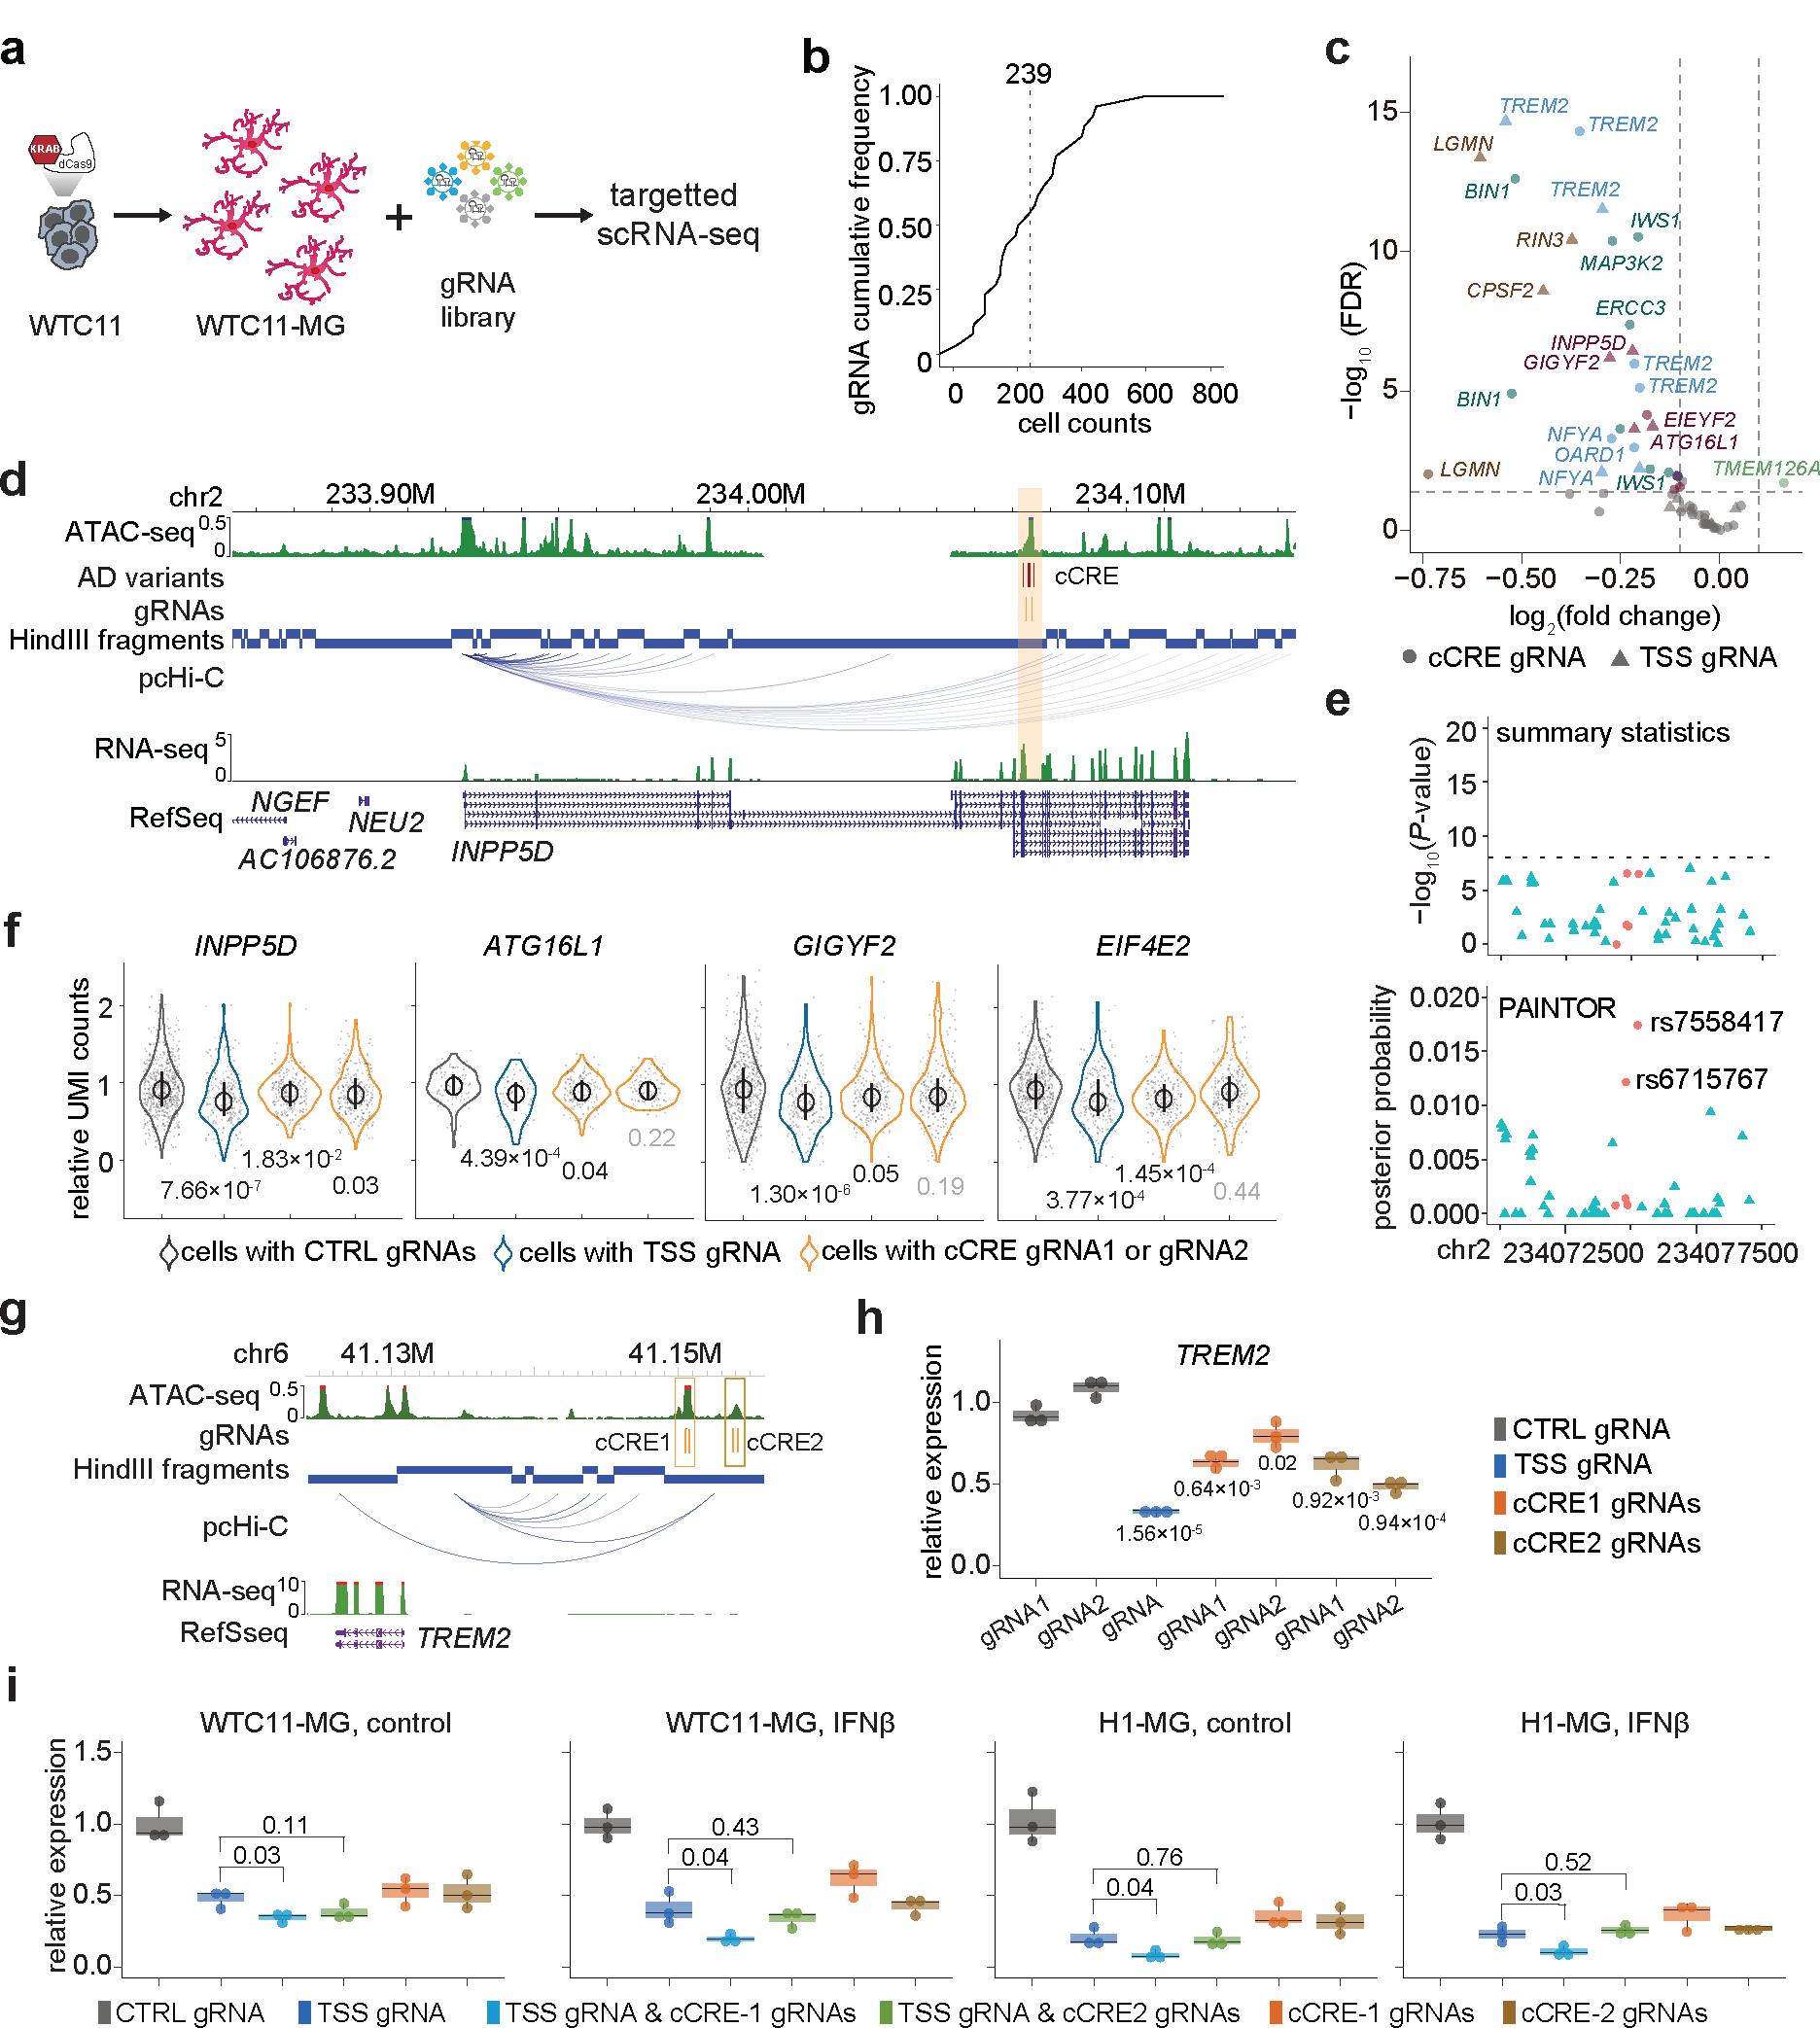
Figure 4. Characterize fine-mapped AD risk loci with pooled CRISPRi and targeted scRNA-seq in hPSC-derived microglia-like cells.

a, Overview of CRISPRi perturbation and single cell gene expression analysis of fine-mapped AD risk loci in iPSC-derived microglia. dCas9-KRAB-WTC11 were differentiated into microglia and transfected with lentivirus library to perturb fine-mapped AD risk loci. CRISPRi effect were evaluated by HyPR-seq after 1 week. b, Cumulative frequency distribution (CFD) of the number of cells with each gRNA used in analysis. c, Volcano plot of the gRNA-to-gene pairs tested in cis. 14 genes were significantly affected by AD risk loci perturbation (FDR < 0.05, log2(fold change) < −0.1) for 10 AD risk variants in 5 cCREs. Genes from the same AD risk locus are labeled with the same color. Triangles mark transcriptional changes of genes in cells with TSS gRNA-gene pairs, and circles mark changes with distal cCRE gRNA-gene pairs. d, A risk cCRE (orange) interacting with the INPP5D promoter. e, The risk cCRE overlaps five prioritized AD variants (red dots) which were not significant (−log10(P value) < 8) in AD summary statistics. f, Quantitative effects of AD risk cCRE on the expression of INPP5D in cis and three other neighboring genes, including ATG16L1, GIGYF2, and EIF4E2. P values calculated using two-sided two-sample t-test and adjusted by Benjamini-Hochberg FDR multiple testing correction. The median, upper and lower quantiles are indicated by circle and bar. Each dot represents one single cell. N are indicated in Supplementary Table 7d. g, Genome browser snapshot of the TREM2 locus. h, CRIPSRi perturbation targeting TREM2 cCREs followed by RT-qPCR analysis in WTC11-derived microglia-like cells. i, Quantification of TREM2 expression in WTC11- and H1-derived microglia-like cells infected with gRNAs for non-human targeting controls (black), TREM2 TSS (dark blue), TSS and cCRE1 (light blue), TSS and cCRE2 (green), cCRE1 (orange), cCRE2 (brown) under control and IFNß stimulated conditions. P values calculated using two-sided two-sample t-test for (h) and (i). Three independent replicates per condition and two sgRNAs per replicate were used for each experiment. Boxplots indicate the median and interquartile range. Whiskers mark the 5th and 95th percentiles.
