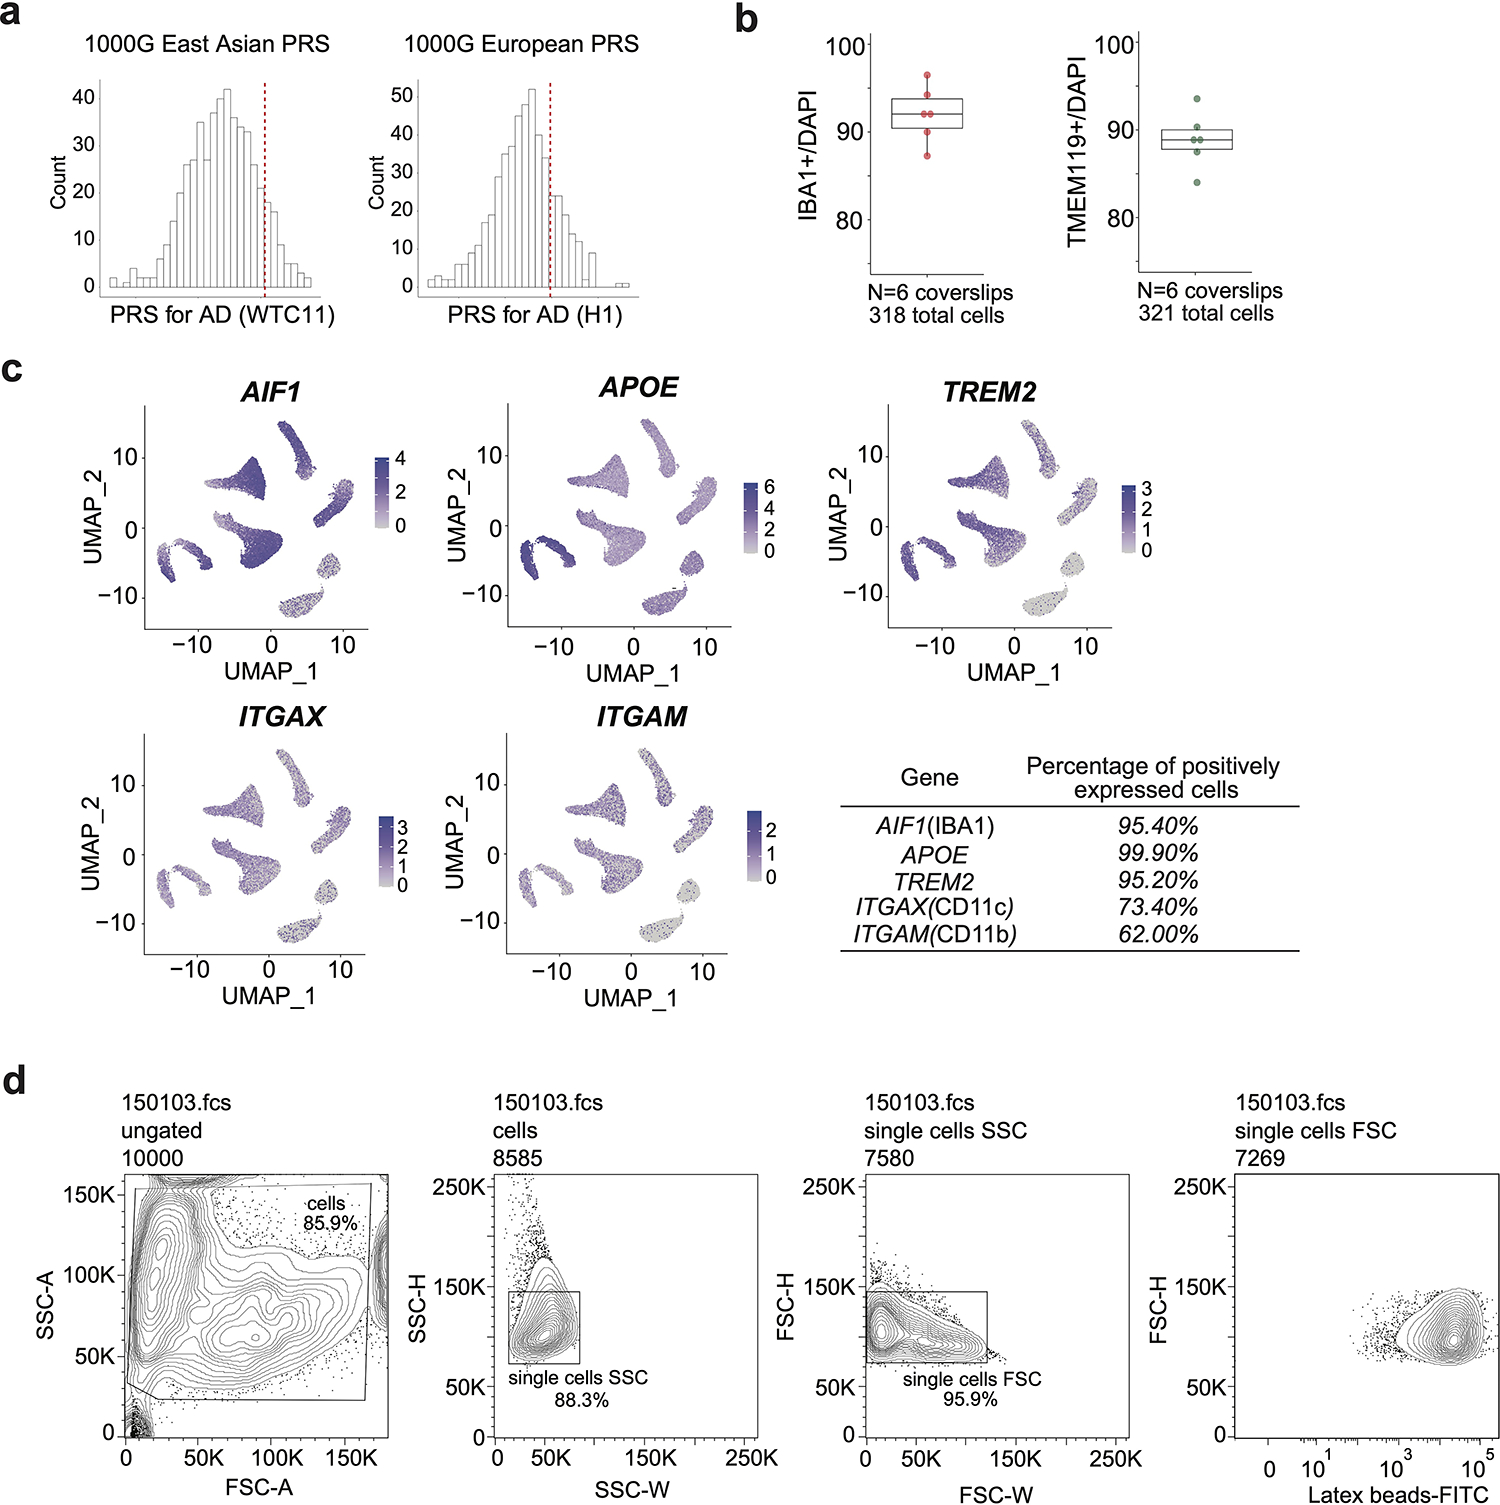
Extended Data Fig. 1. Characterization of the hPSC-derived microglia-like cells.

a, PRS of each donor are shown with respect to PRS for individuals of matched continental ancestry from the 1000 Genomes Project (1000G). For WTC11, we used 1000G East Asian (EAS), and H1 European (EUR). The red dashed lines represent PRS for WTC11 and H1. b, The yield of IBA1 or TMEM119 positive microglia is represented by the number of immunostaining positive cells divided by the total number of cells. Six coverslips from 3 independent differentiations were used for statistics. Boxplots indicate the median and interquartile range. Whiskers mark the 5th and 95th percentiles. c, Marker gene expressions are displayed in the UMAP of scRNA-seq. Percentage of positively expressed cells are calculated by pct.exp in the Seurat package. d, Representative contour plots depicting FACS gating strategy. Cells were separated from debris of various sizes based on the forward scatter area (FSC-A) and side scatter area (SSC-A). Two singlet gates were applied using the width and height metrics of the side scatter (SSC-H versus SSC-W) and forward scatter (FSC-H versus FSC-W). Latex beads-FITC signals are shown for all singlets.
