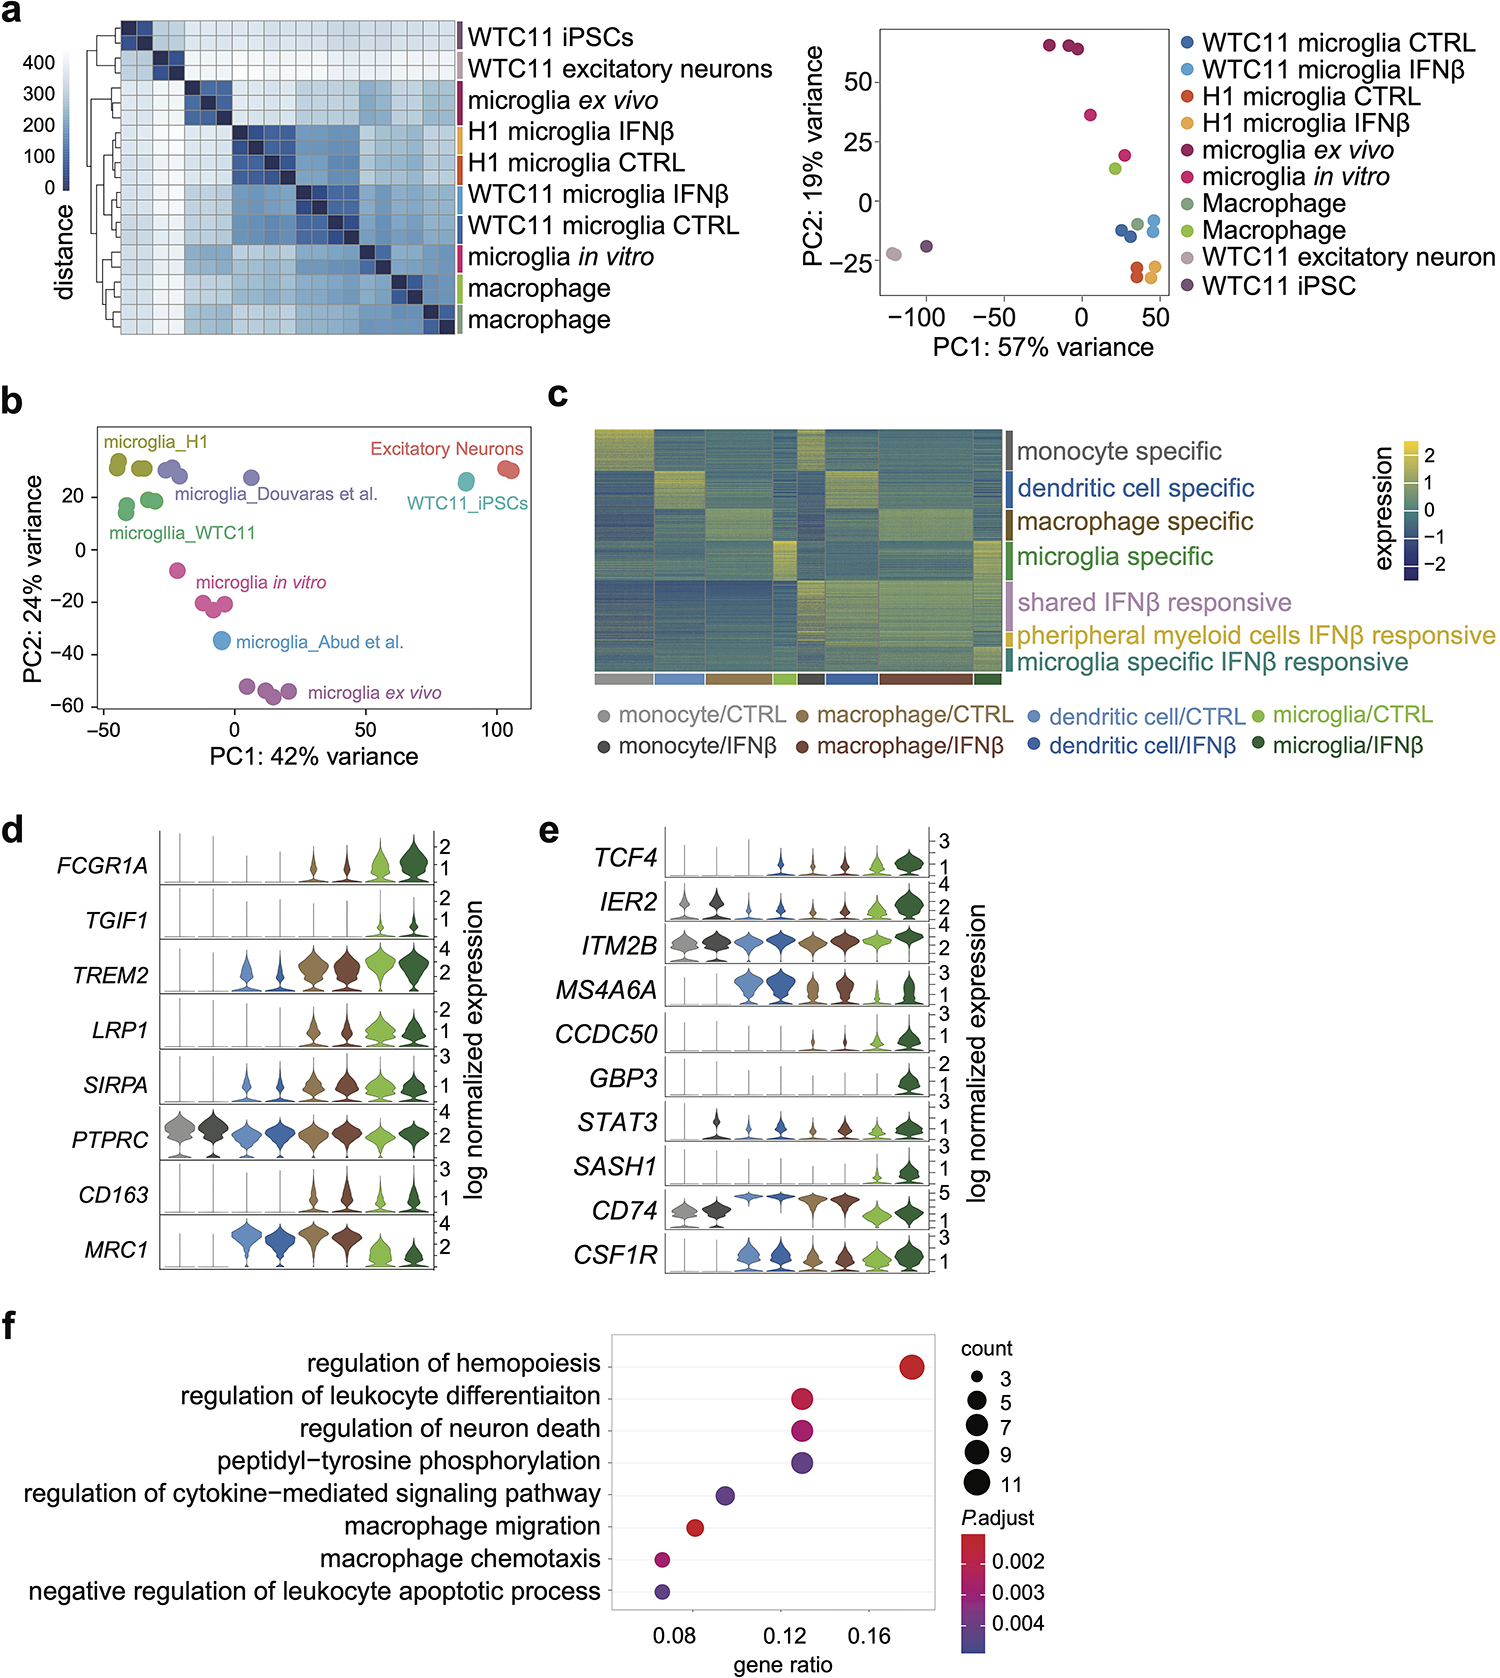
Extended Data Fig. 2. Transcriptome analysis of hPSC-derived microglia-like cells with other cell types.

a, RNA-seq replicates were hierarchically clustered according to gene expression distances using DESeq2 (left). PCA plot displaying all samples (right). b, PCA plots of RNA-seq comparisons between hPSC-microglia differentiated with multiple protocols11,13 and primary microglia in vitro and in vivo12 and other cell types3. c, Heatmap showing scRNA-seq analysis of cell type-specific and shared IFNß stimulation responsive genes in microglia and peripheral myeloid cells. d, Examples of genes highly expressed (top 5) or lowly expressed (bottom 3) in microglia compared to peripheral myeloid cells. e, Examples of microglia-specific IFNß responsive genes. f, Top enriched GO terms of microglia specific IFNß responsive genes. Enriched GO terms are ranked by the percentage of total microglia-specific genes in the given GO term. The counts of enriched genes and adjusted P value for multiple comparisons were reported. Expanded lists of enriched GO terms are available in Supplementary Table 3.
