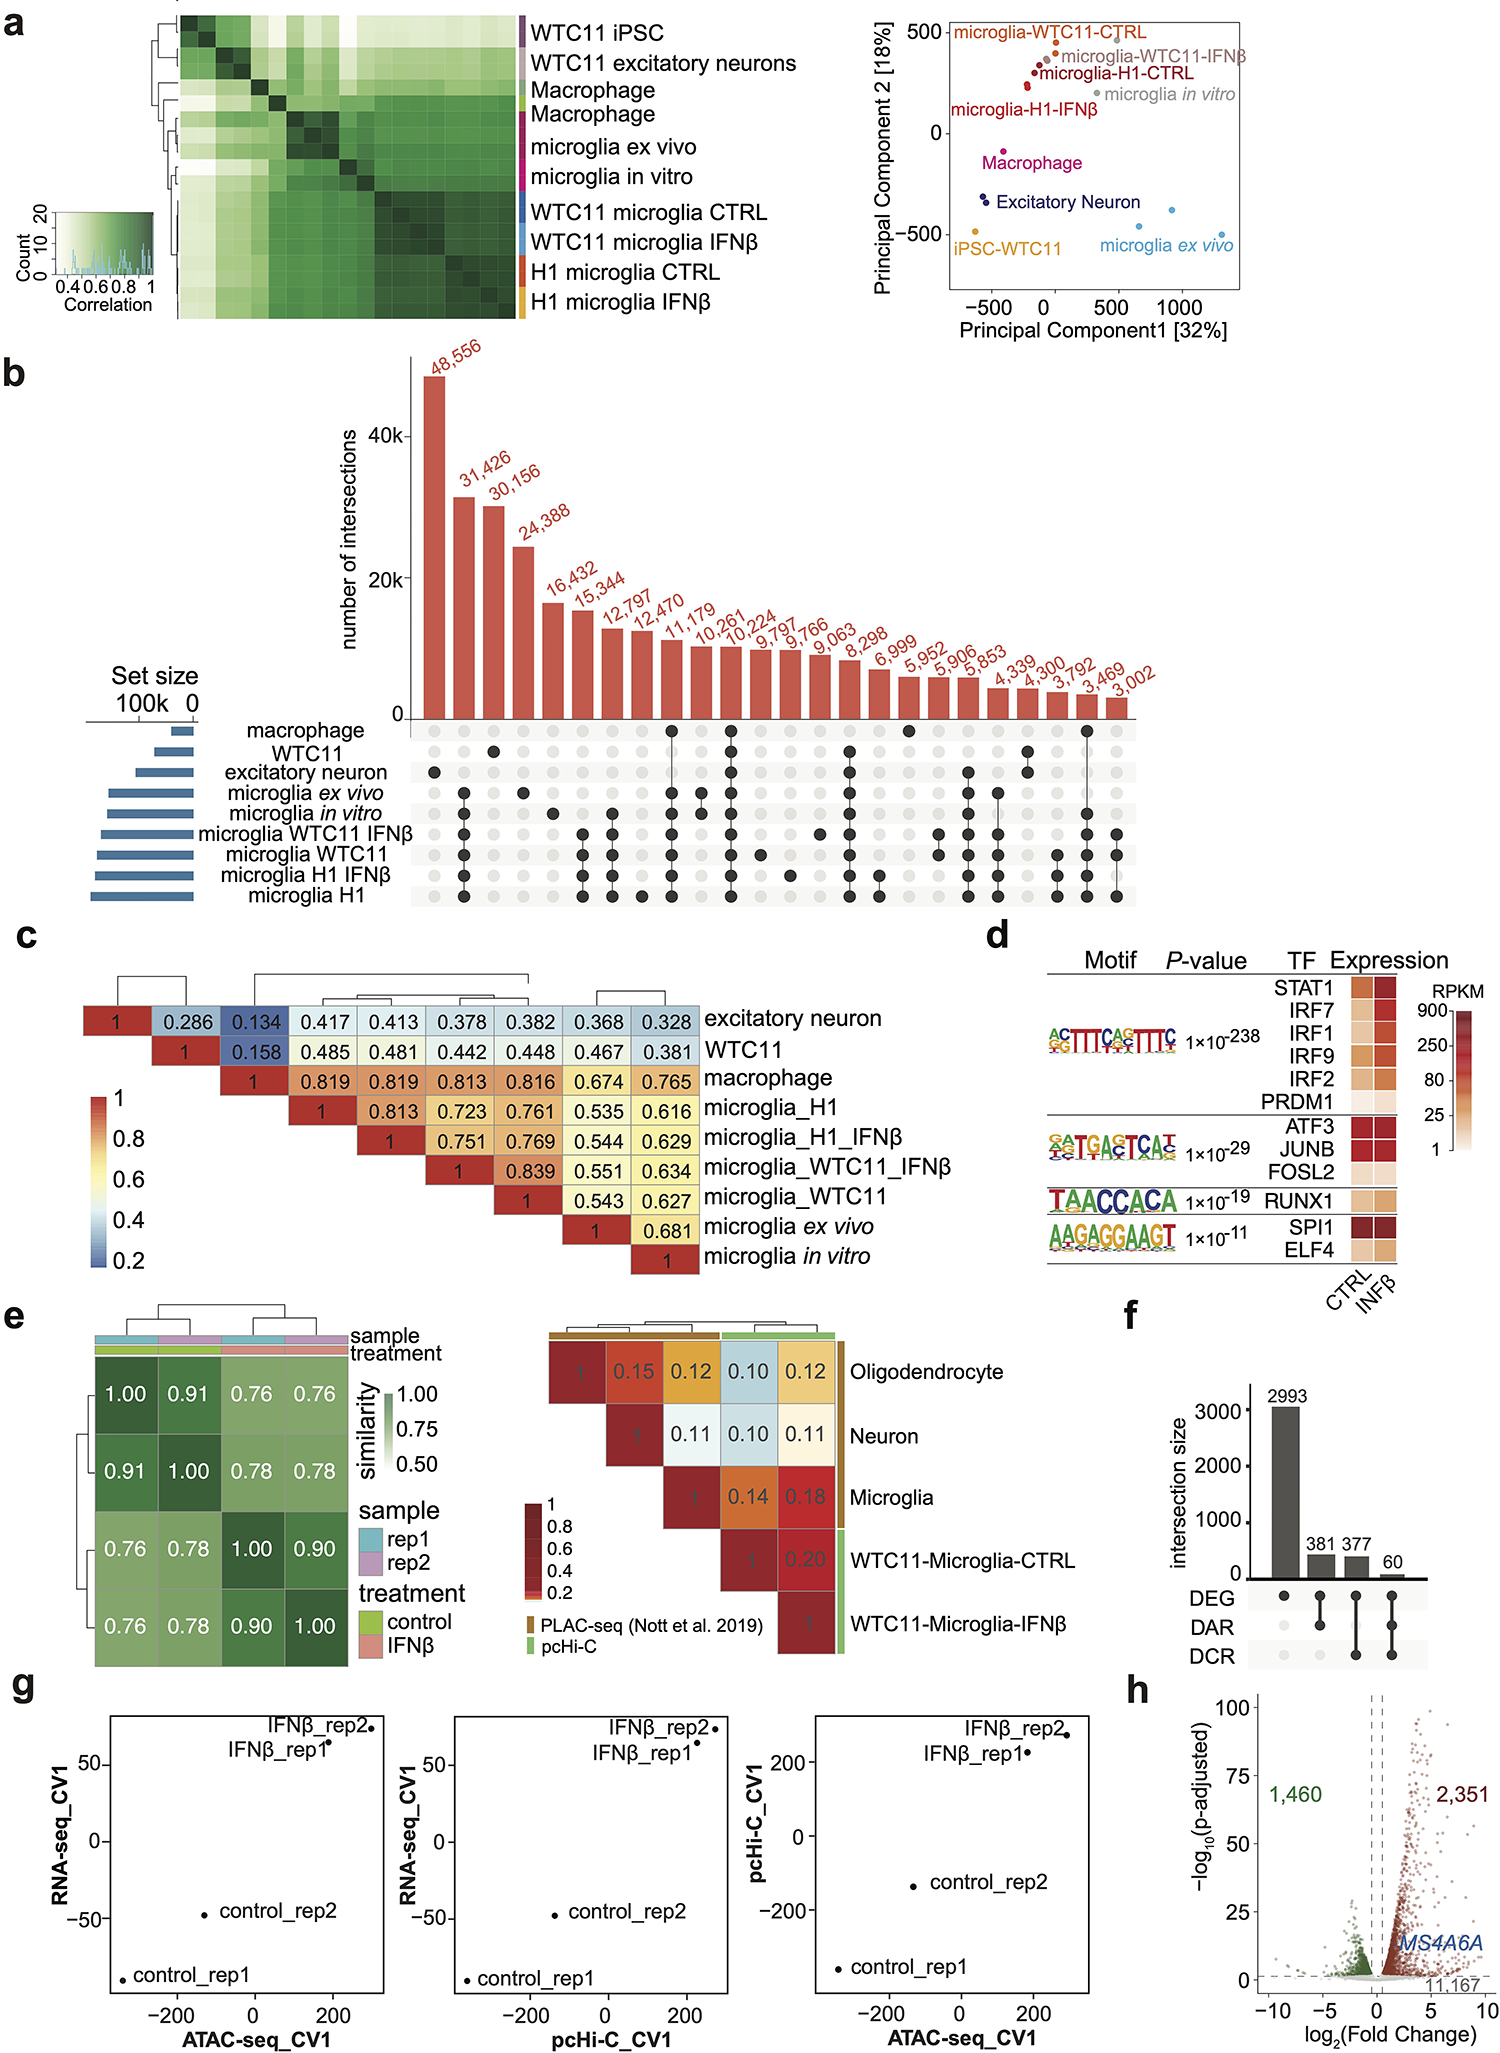
Extended Data Fig. 4. Integrative analysis of chromatin accessibility, chromatin interactions, and gene expression.

a, Heatmap with pairwise correlations and hierarchical clustering of read densities at the set of unified open chromatin peaks for ATAC-seq datasets (left panel). PCA plot of ATAC-seq comparisons between hPSC-derived microglia-like cells, primary microglia12 and other cell types3 (right panel). b, Upset plot showing overlapping peaks of ATAC-seq datasets in WTC11 (hPSC), excitatory neuron, macrophage, microglia ex vivo, microglia in vitro, microglia derived from WTC11 (control and IFNβ stimulated) and microglia derived from H1 (control and IFNβ stimulated). c, Heatmap of Jaccard Index for pairwise overlap among the 9 ATAC-seq datasets in (b). Two-sided chi-squared tests on pairwise overlapping all led to P values less than 2.2e-16. d, Motif enrichment analysis for 93 TSS overlapping DARs in response to IFNß treatment. P values from HOMER and corresponding TF expression levels are shown. e, Heat map with pairwise similarity based on reproducibility analysis for pcHi-C replicates using HPRep (left). Heatmap of the Jaccard index for comparison of chromatin interaction profile in primary microglia, neuron, oligodendrocyte1 and hPSC derived microglia (right). f, Upset plot showing most of the IFNß stimulation responsive genes (total 3,811 including 1,460 down-regulated and 2,351 up-regulated genes) are not associated with differential chromatin accessible regions (DARs) or differential chromatin interacting regions (DCRs). g, Pairwise canonical variable (CV) plots for all samples: (left) RNA-seq CV1 vs. ATAC-seq CV1; (middle) RNA-seq CV1 vs pcHi-C CV1; (right) pcHi-C CV1 vs ATAC-seq CV1. h, Volcano plot showing differentially expressed genes upon IFNß stimulation in microglia with a cutoff of adjusted P < 0.05 and absolute log2(fold change) > 0.5. MS4A6A gene is labeled.
