Figure 1.
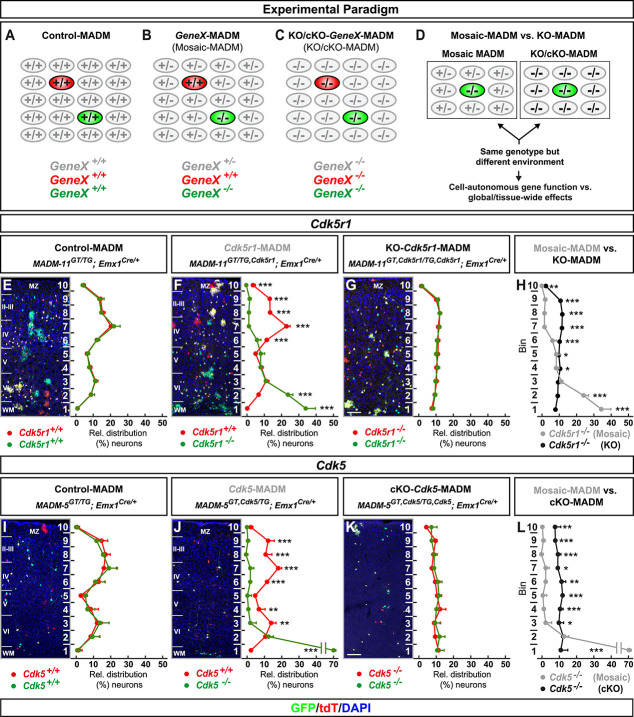
MADM analysis reveals that global tissue-wide effects predominates the cell-autonomous phenotype due to loss of p35/CDK5. (A–D) Experimental MADM paradigm to genetically dissect cell-autonomous gene function and non-cell-autonomous effects. (A) Control (control-MADM: all cells GeneX+/+); (B) sparse genetic mosaic (GeneX-MADM: only green cells are GeneX−/− mutant, red cells are GeneX+/+ in an otherwise heterozygous GeneX+/− environment); (C) global/whole-tissue gene knockout (KO/cKO-GeneX-MADM: all cells mutant); (D) direct phenotypic comparison of mutant cells in GeneX-MADM (mosaic MADM) to mutant cells in KO/cKO-gene-MADM (KO/cKO-MADM). Any significant difference in their respective phenotypes implies non-cell-autonomous effects. (E–H) Analysis of green (GFP+) and red (tdT+) MADM-labeled projection neurons in (E) control-MADM (MADM-11GT/TG;Emx1Cre/+); (F) Cdk5r1-MADM (MADM-11GT/TG,Cdk5r1;Emx1Cre/+); and (G) KO-Cdk5r1-MADM (MADM-11GT,Cdk5r1/TG,Cdk5r1;Emx1Cre/+). Relative distribution (%) of MADM-labeled projection neurons is plotted in ten equal zones across the cortical wall. (H) Direct distribution comparison of Cdk5r1−/− mutant cells in Cdk5r1-MADM (grey) versus KO-Cdk5r1-MADM (black) distribution. (I–L) Analysis of green (GFP+) and red (tdT+) MADM-labeled projection neurons in (I) control-MADM (MADM-5GT/TG;Emx1Cre/+); (J) Cdk5-MADM (MADM-5GT/TG,Cdk5;Emx1Cre/+); and (K) KO-Cdk5-MADM (MADM-11GT,Cdk5/TG,Cdk5;Emx1Cre/+). Relative distribution (%) of MADM-labeled projection neurons is plotted in 10 equal zones (1–10) across the cortical wall. (L) Direct distribution comparison of Cdk5−/− mutant cells in Cdk5-MADM (grey) versus KO-Cdk5-MADM (black) distribution. Nuclei were stained using DAPI (blue). N = 3 for each genotype with 10 (MADM-11) and 20 (MADM-5) hemispheres analysed. Data indicate mean ± SD, *P < 0.05, **P < 0.01 and ***P < 0.001. Scale bar: 100 μm. Marginal zone (MZ), cortical layers (II–VI), white matter (WM).

