Figure 3.

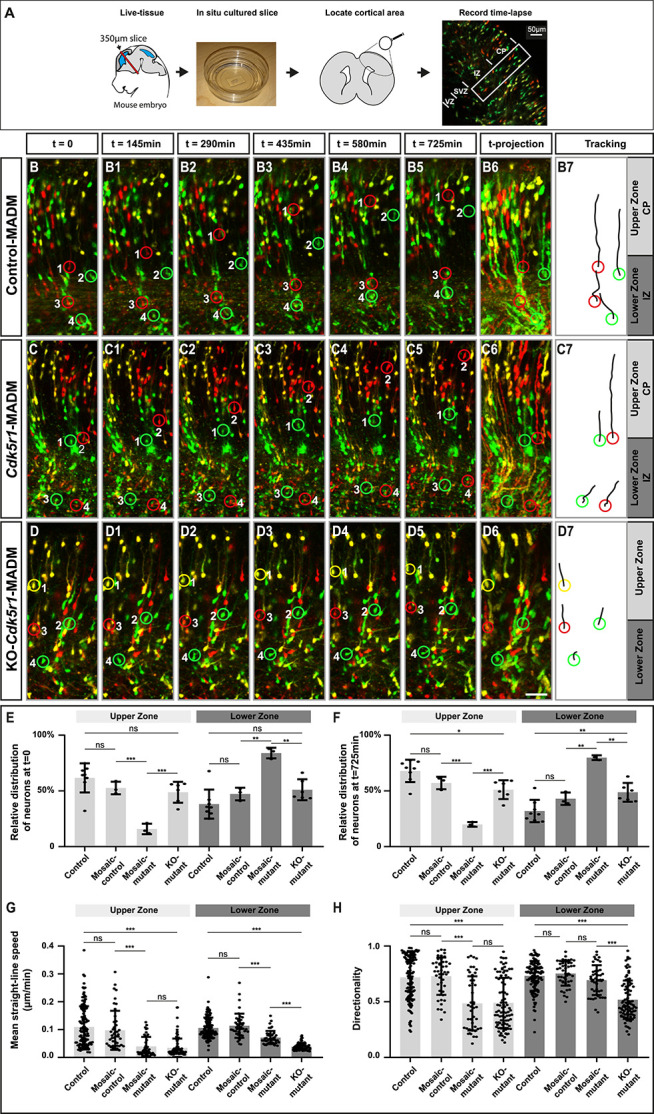
Projection neuron migration dynamics upon sparse and global KO of p35/CDK5. (A) Experimental setup for time-lapse imaging of MADM-labeled neurons in developing somatosensory cortex at E16. (B–D) Time-lapse imaging of (B-B5) control-MADM (MADM-11GT/TG;Emx1Cre/+), (C-C5) Cdk5r1-MADM (MADM-11GT/TG,Cdk5r1;Emx1Cre/+) and (D-D5) KO-Cdk5r1-MADM (MADM-11GT,Cdk5r1/TG,Cdk5r1; Emx1Cre/+). (B6, C6, D6) 12 h time projection of sequential images in IZ (lower zone) and emerging CP (upper zone) at 15 min frame rate. (B7, C7, D7) Tracking trajectories of indicated neurons (red and green rings) in control-MADM (B7), Cdk5r1-MADM (C7) and KO-Cdk5r1-MADM (D7). (E) Relative distribution of neurons at the start of the time-lapse t = 0 for each replicate time-lapse per genotype. (F) Relative distribution of neurons at the end of the time-lapse t = 725 min for each replicate time-lapse per genotype. (G) Mean straight-line speed of the top 15 tracks per replicate time-lapse per genotype. (H) Directionality of the top 15 tracks per replicate time-lapse per genotype. N = 3 videos from >2 independent animals. Data indicate mean ± SD, *P < 0.05, **P < 0.01 and ***P < 0.001. Scale bar: 40 μm.
