Figure 5.

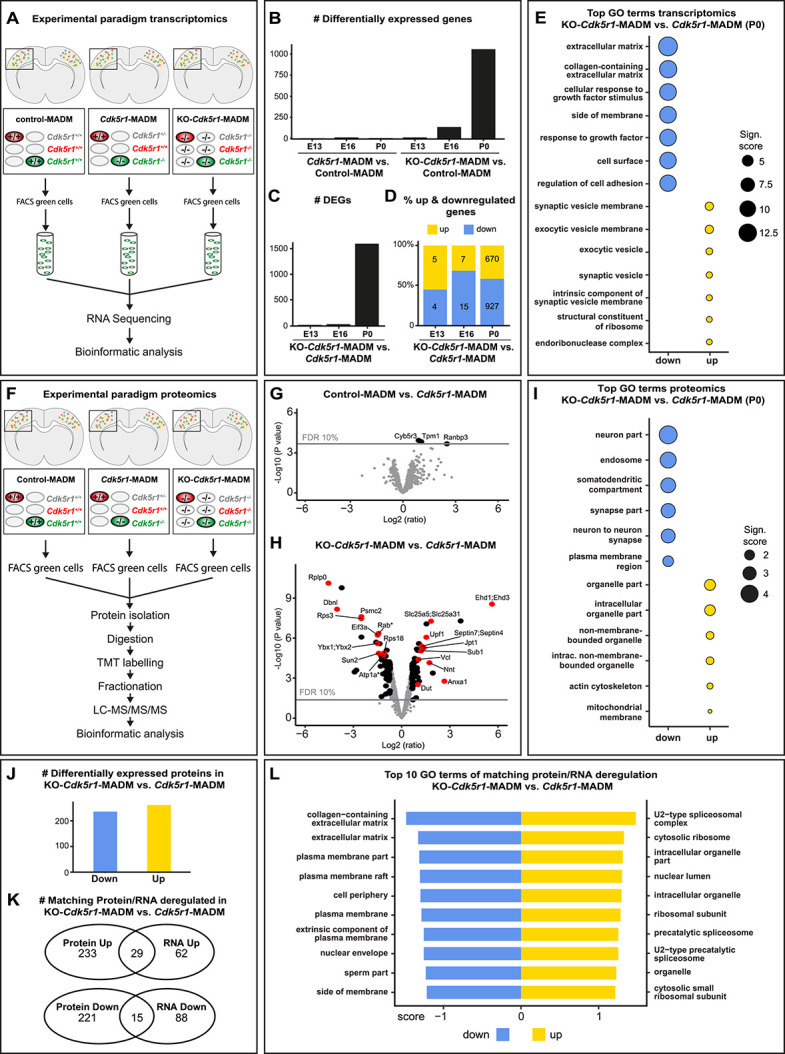
Gene and protein expression in Cdk5r1−/− mutant cells upon sparse and global KO. (A) Experimental paradigm and pipelines for gene expression profiling in control-MADM (left), Cdk5r1-MADM (middle) and KO-Cdk5r1-MADM (right). (B) Number of differentially expressed genes (DEGs) in Cdk5r1-MADM and KO-Cdk5r1-MADM versus control at E13, E16 and P0. (C) Number of DEGs in KO-Cdk5r1-MADM versus Cdk5r1-MADM at E13, E16 and P0. (D) Percentage of up- and downregulated genes in KO-Cdk5r1-MADM versus Cdk5r1-MADM at E13, E16 and P0. (E) Top GO terms associated with genes in (C and D) at P0. Note that GO term enrichments for upregulated genes are non-significant. (F) Experimental paradigm and pipelines for proteome profiling in control-MADM (left), Cdk5r1-MADM (middle) and KO-Cdk5r1-MADM (right). (G) Volcano plot showing deregulated proteins in control-MADM versus Cdk5r1-MADM comparison at P0. Note that only three proteins were significantly upregulated. (H) Volcano plot showing deregulated proteins KO-Cdk5r1-MADM versus Cdk5r1-MADM comparison at P0. Asterisks indicate that Rab and Atp1a protein groups consist of several isoforms not listed in the figure. (I) Top enriched GO terms associated with genes encoding the proteins as shown in (H). (J) Number of genes associated with differentially expressed proteins in KO-Cdk5r1-MADM versus Cdk5r1-MADM. Note that criteria for significant differential expression were relaxed compared to (H). (K) Venn diagrams indicating the overlap of deregulated genes in transcriptomic and proteomic datasets in KO-Cdk5r1-MADM versus Cdk5r1-MADM. (L) Top 10 GO-terms associated with gene sets that are up- and downregulated in both (transcriptomic and proteomic) data sets (overlap in K).
