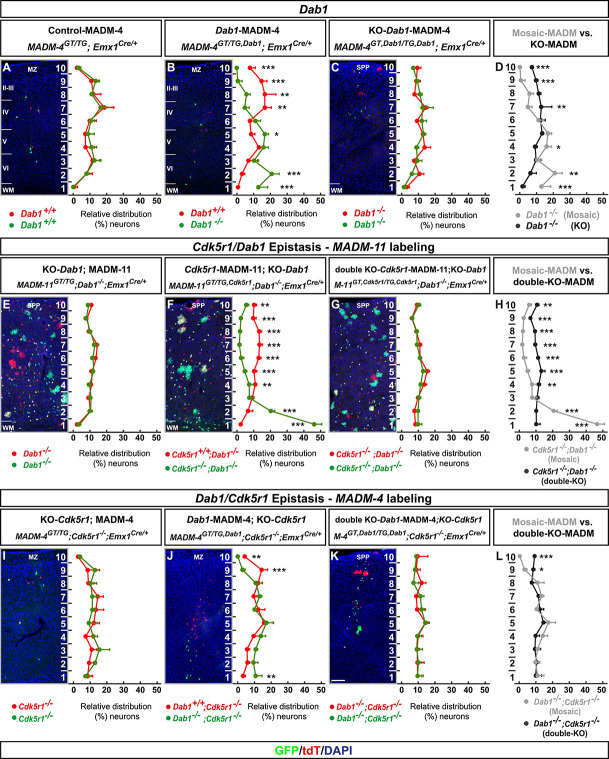
Figure 6.
MADM-based analysis of Dab1 and Cdk5r1/Dab1 epistasis. (A–D) Analysis of green (GFP+) and red (tdT+) MADM-labeled projection neurons in (a) control-MADM (MADM-4GT/TG;Emx1Cre/+); (F) Dab1-MADM (MADM-4GT/TG,Dab1;Emx1Cre/+); and (G) KO-Dab1-MADM (MADM-4GT,Dab1/TG,Dab1;Emx1Cre/+). Relative distribution (%) of MADM-labeled projection neurons is plotted in 10 equal zones across the cortical wall. (H) Direct distribution comparison of Dab1−/− mutant cells in Dab1-MADM (grey) versus KO-Dab1-MADM (black) distribution. (E–H) Cdk5r1/Dab1 epistasis in MADM-11 labeling background. Analysis of green (GFP+) and red (tdT+) MADM-labeled projection neurons in (E) KO-Dab1; MADM-11 (MADM-11GT/TG;Dab1−/−;Emx1Cre/+), (F) Cdk5r1-MADM-11;KO-Dab1 (MADM-11GT/TG,Cdk5r1;Dab1−/−;Emx1Cre/+) and (G) double-KO-Cdk5r1-MADM-11;KO-Dab1 (MADM-11GT,Cdk5r1/TG,Cdk5r1;Dab1−/−;Emx1Cre/+). Relative distribution (%) of MADM-labeled projection neurons is plotted in 10 equal zones across the cortical wall. (H) Direct distribution comparison of Cdk5r1−/− mutant cells upon sparse (grey) and global (black) KO in Dab1−/− mutant background. (I–L) Dab1/Cdk5r1 epistasis in MADM-4 labeling background. Analysis of green (GFP+) and red (tdT+) MADM-labeled projection neurons in (I) KO-Cdk5r1; MADM-4 (MADM-4GT/TG;Cdk5−/−;Emx1Cre/+), (J) Dab1-MADM-4;KO-Cdk5r1 (MADM-4GT/TG,Dab1;Cdk5r1−/−;Emx1Cre/+) and (G) double-KO Dab1-MADM-4;KO-Cdk5r1 (MADM-4GT,Dab1/TG,Dab1;Cdk5r1−/−;Emx1Cre/+). Relative distribution (%) of MADM-labeled projection neurons is plotted in 10 equal zones across the cortical wall. (H) Direct distribution comparison of Dab1−/− mutant cells upon sparse (grey) and global (black) KO in Cdk5r1−/− mutant background. All analysis was carried out at P21. N = 3 for each genotype. From each animal 10 (MADM-11) or 20 (MADM-4) hemispheres were analysed. Nuclei were stained using DAPI (blue). Data indicate mean ± SD, *P < 0.05, **P < 0.01 and ***P < 0.001. Marginal zone (MZ), superplate (SPP), white matter (WM). Scale bar: 100 μm.

