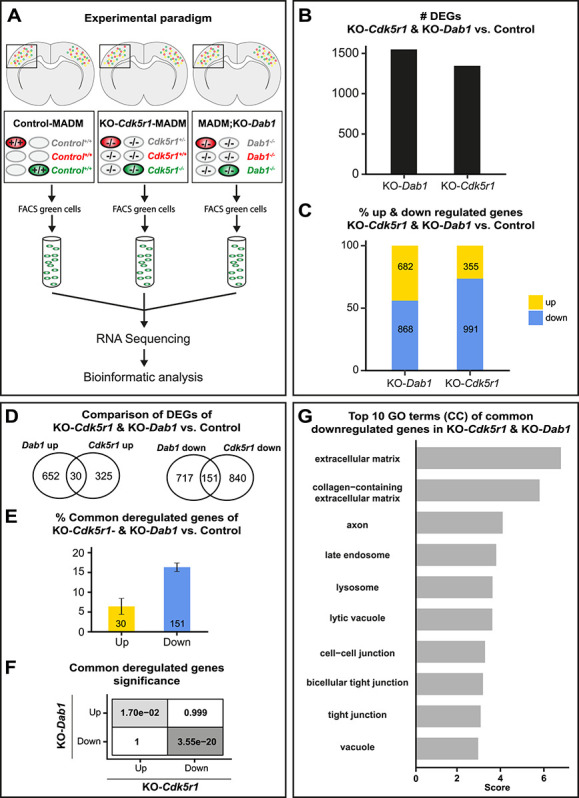
Figure 7.

Gene expression upon combined global KO of Cdk5r1 and Dab1. (A) Experimental paradigm and pipelines for gene expression profiling in control-MADM (left), KO-Cdk5r1-MADM (middle; KO-Cdk5r1) and MADM;KO-Dab1 (right; KO-Dab1) at P0. (B) Number of differentially expressed genes (DEGs) in KO-Cdk5r1 and KO-Dab1 versus control. (C) Percentage of up- and downregulated genes in KO-Cdk5r1 and KO-Dab1 versus control. (D) Venn diagrams showing common up- and down-regulated genes in KO-Cdk5r1 and KO-Dab1 versus control. (E) Percentage of common up- and downregulated genes in KO-Cdk5r1 and KO-Dab1 versus control. (F) Significance of all pairwise overlaps of DEGs shown in (D). (G) Top 10 GO terms of commonly downregulated genes in KO-Cdkr5r1 and KO-Dab1, according to overlap shown in (D, right). Commonly upregulated genes did not yield any significant GO term enrichment.
