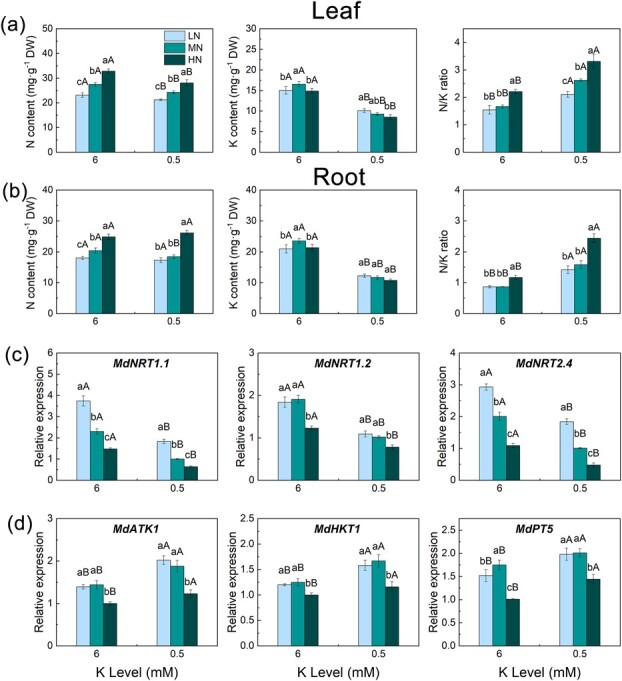
Figure 2.

Element content and the relative expression of N and K uptake genes in rootstock roots treated with different N and K levels. N content, K content, and N/K ratio in the leaves (a), N content, K content, and N/K ratio in the roots (b), expression of N uptake genes in roots (c), and expression of K uptake genes in roots (d). Data are means ± standard deviation (n = 3). Different capital (lower case) letters indicate statistical differences between K (N) levels under the same N (K) level (P < 0.05) according to Duncan’s test.
