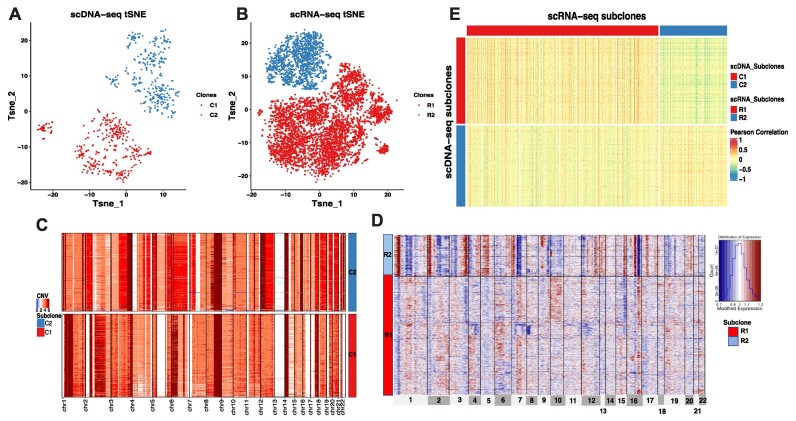
Figure 2.
The coherent clonal structure between scDNA and scRNA of the mixture ovarian cancer cell lines OV. (A) tSNE plot of scDNA clones. (B) tSNE plot of scRNA clones. (C) Heatmap shows CNV changes across scDNA clones. (D) Heatmap shows inferred CNV changes estimated by gene expression level across scRNA clones. (E) Heatmap of Pearson’s Correlation between single cells in coherent clones from scDNA and scRNA. Cells composing the same clone were coded in the same color. Each row represents a single cell and each column represents a genomic region for (C) and (D). The color in each dot of the heatmap represents the CNV status for (C) and (D). In panel (E), each row represents a single cell of scDNA, while each column represents a single cell of scRNA, the color in the heatmap represents the Pearson’s Correlation of cells between scDNA and scRNA.

