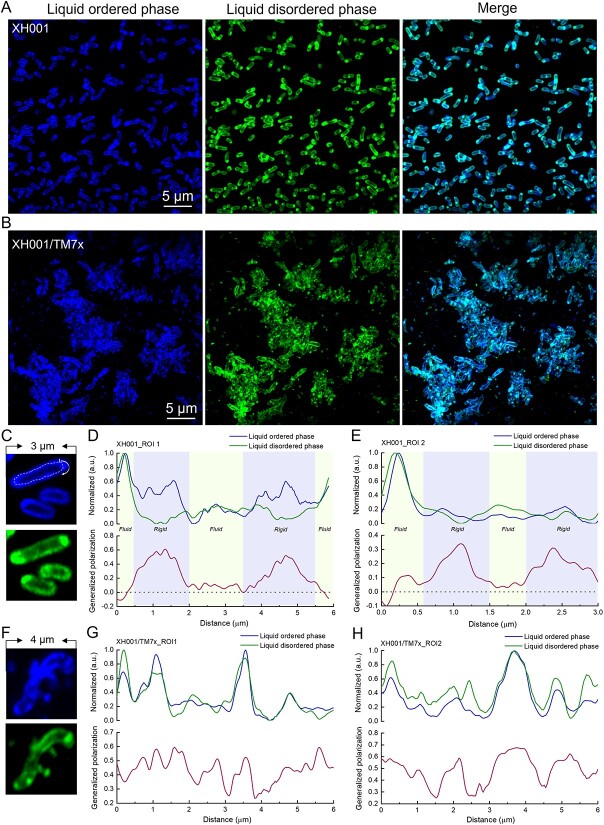
Figure 2.
Mapping membrane fluidity of XH001 and XH001/TM7x through super-resolution fluorescence imaging of Laurdan-labeled XH001 and XH001/TM7x; (A and B) super-resolution fluorescence images of liquid-ordered phases and liquid-disordered phases from XH001/TM7x and XH001, respectively; excitation laser: 405 nm; fluorescence signal from the liquid-ordered/disordered phase was collected by an optical bandpass filter (410–460 nm) and (470 nm–550 nm), respectively; scalar bar = 5 μm; (C–E) zoom-in view of Laurdan-labeled XH001 cells along with single-cell mapping of GP; (F–H) zoom-in view of Laurdan-labeled XH001/TM7x along with single-cell mapping of GP; a GP value of 0 was highlighted by black dashed lines; panels (C–H) are representative of at least 10 cells randomly chosen from multiple fields of view.

