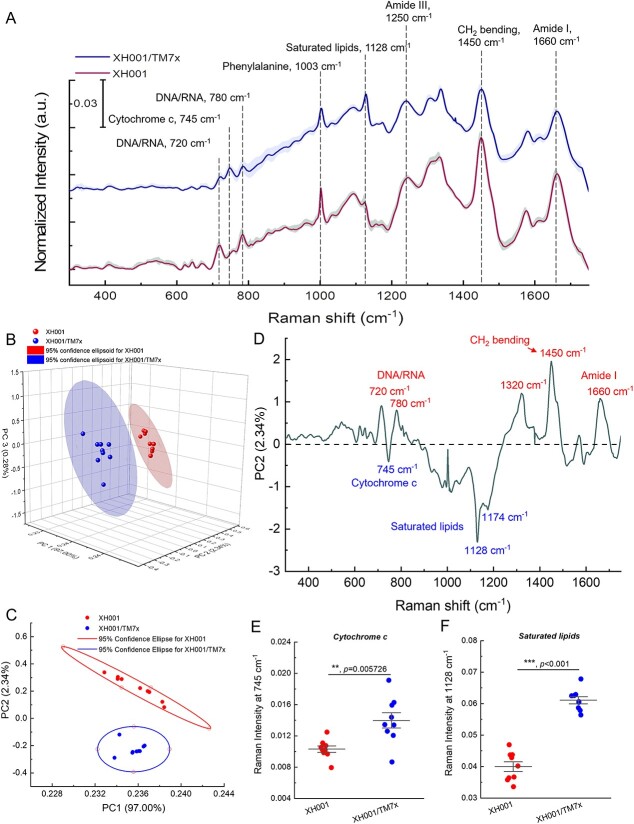
Figure 4.
Raman spectroscopy of XH001 and XH001/TM7x along with the corresponding PCA; (A) Raman spectra of XH001 cells and XH001/TM7x from three biological replicates after vector normalization; data: mean (solid line) ± standard deviation (SD); interested Raman peaks were highlighted by dashed lines; (B) 3D PCA (PCA) plot of Raman spectra of XH001 cells and XH001/TM7x; each dot represents a Raman spectrum; data are from three biological replicates; (C) 2D PCA plot from principal components 1 (97.00% of the total variation) and 2 (2.34% of the total variation); 95% confidence intervals were represented by ellipses; (D) spectral information of PC2; biomolecules with enhanced production in the case of XH001/TM7x were highlighted below the dashed line and XH001 cells above the dashed line; (E and F) quantitative and statistical analyses of Raman intensities from cytochrome c (745 cm−1) and saturated lipids (1128 cm−1); statistical analysis was conducted through a two-tailed Student’s unpaired t-test; ***: P < .001.

