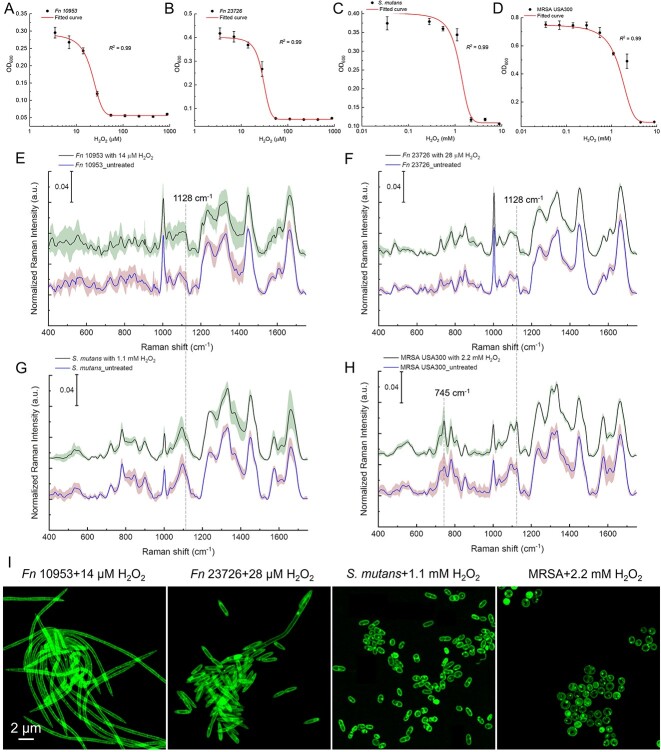
Figure 7.
Characterization of other bacteria under stress conditions by Raman spectroscopy and super-resolution fluorescence microscopy; (A–D) dose–response of H2O2 against Fn 10 953, Fn 23 726, S. Mutans, and MRSA USA300; data were fitted by a dose–response relationship function; (E–H) Raman spectra of Fn 10 953 (E), Fn 23 726 (F), S. mutans (G), and MRSA USA300 (H) with and without the treatment of H2O2; data: mean (solid line) ± SD (shadow) from three biological replicates; Raman peaks at 745 and 1128 cm−1 were highlighted by dashed lines; (I) super-resolution fluorescence imaging of BODIPY C1, C12-labeled Fn 10 953, Fn 23 726, S. Mutans, and MRSA after the treatment of sub-MIC H2O2; scalar bar = 2 μm.

