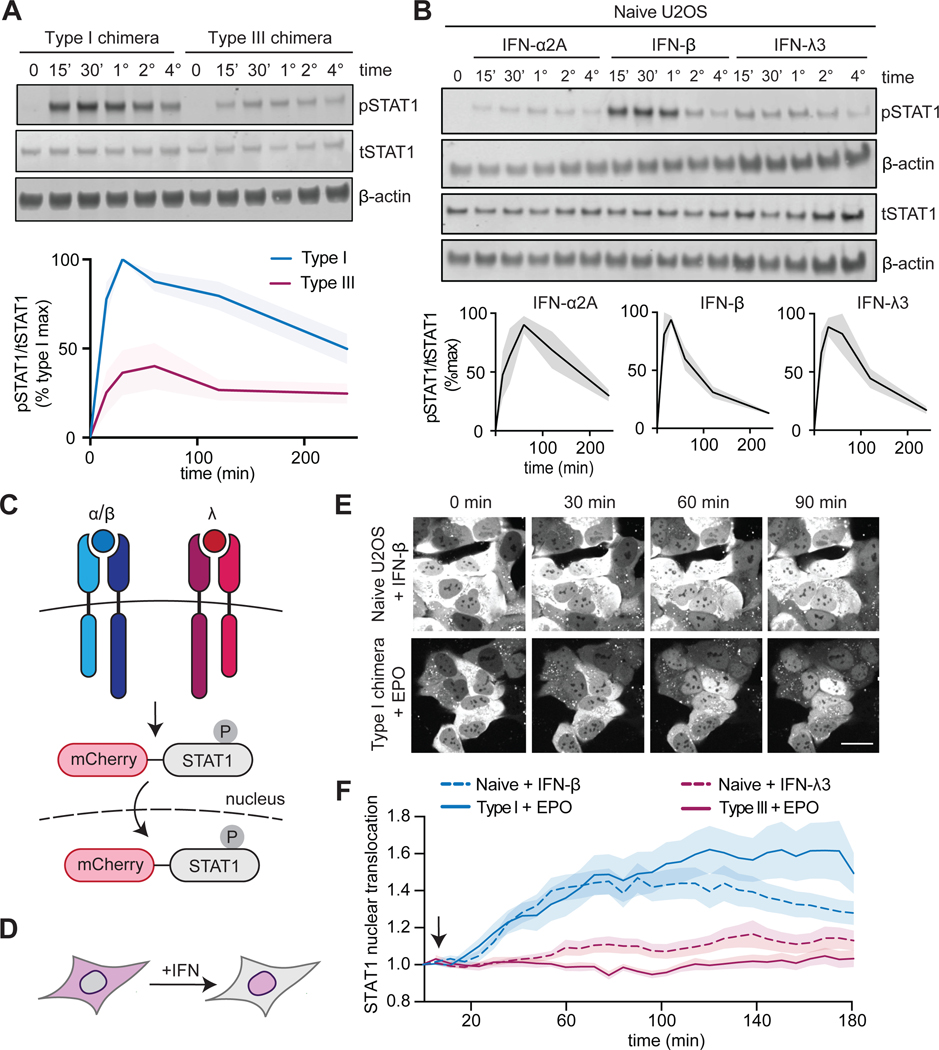
Fig. 3. STAT activation dynamics are sustained after activation of chimeric type I and III IFN receptors.
(A) Top: U2OS cells expressing chimeric type I or III IFN receptors were treated with EPO (100 ng/ml) for the indicated times and analyzed by Western blotting with antibodies against the indicated proteins. β-actin was used as a loading control. Bottom: The relative abundances of pSTAT1 to tSTAT1 in the indicated samples from three independent experiments were determined by densitometry analysis and are expressed as a percentage of the maximal pSTAT1 abundance in EPO-treated “Type I chimera” cells, which was set at 100%. The shaded area indicates the SEM. (B) Top: Naïve U2OS cells were treated with recombinant IFN-β (1000 IU/ml), IFN-α2A (1000 IU/ml), IFN-λ1 (100 ng/ml), IFN-λ2 (100 ng/ml), or IFN-λ3 (100 ng/ml) for the indicated times and analyzed by Western blotting for pSTAT1 and tSTAT1. β-actin was used as a loading control. Bottom: The relative abundances of pSTAT1 to tSTAT1 in the indicated samples from three independent experiments were determined by densitometry analysis and are expressed as a percentage of the maximal pSTAT1 abundance in IFN-β–treated naïve cells, which was set at 100%. The shaded area indicates the SEM. Data are representative of three independent experiments. (C and D) Schematics illustrating the nuclear localization of the mCherry-STAT1 live cell reporter in cells undergoing type I or III IFN signaling. (E) Representative images of mCherry-STAT1 fluorescence in naïve U2OS cells treated with IFN-β (1000 IU/ml) or in cells expressing the chimeric type I IFN receptor and treated with EPO (100 ng/ml). Treatments were started after the first set of images was taken (4 min). Scale bar, 10 μm. (F) Cells expressing mCherry-STAT1 and either type I or III IFN receptor chimeras were treated with EPO (100 ng/ml) and analyzed by confocal microscopy to determine nuclear fluorescence. Naïve U2OS cells treated with IFN-β (1000 IU/ml) or IFN-λ3 (100 ng/ml) were imaged as positive controls. Images were collected every 4 min for 3 hours. The arrow indicates the addition of ligand (immediately after the first round of imaging). Each condition included n>20 replicates; the shaded region shows the SEM. (A to F) The type I chimera consists of EPORhet-IFNAR2 paired with EPORM150E-IFNAR1, whereas the type III chimera consists of EPORhet-IFNLR1 paired with EPORM150E-IL10RB.

