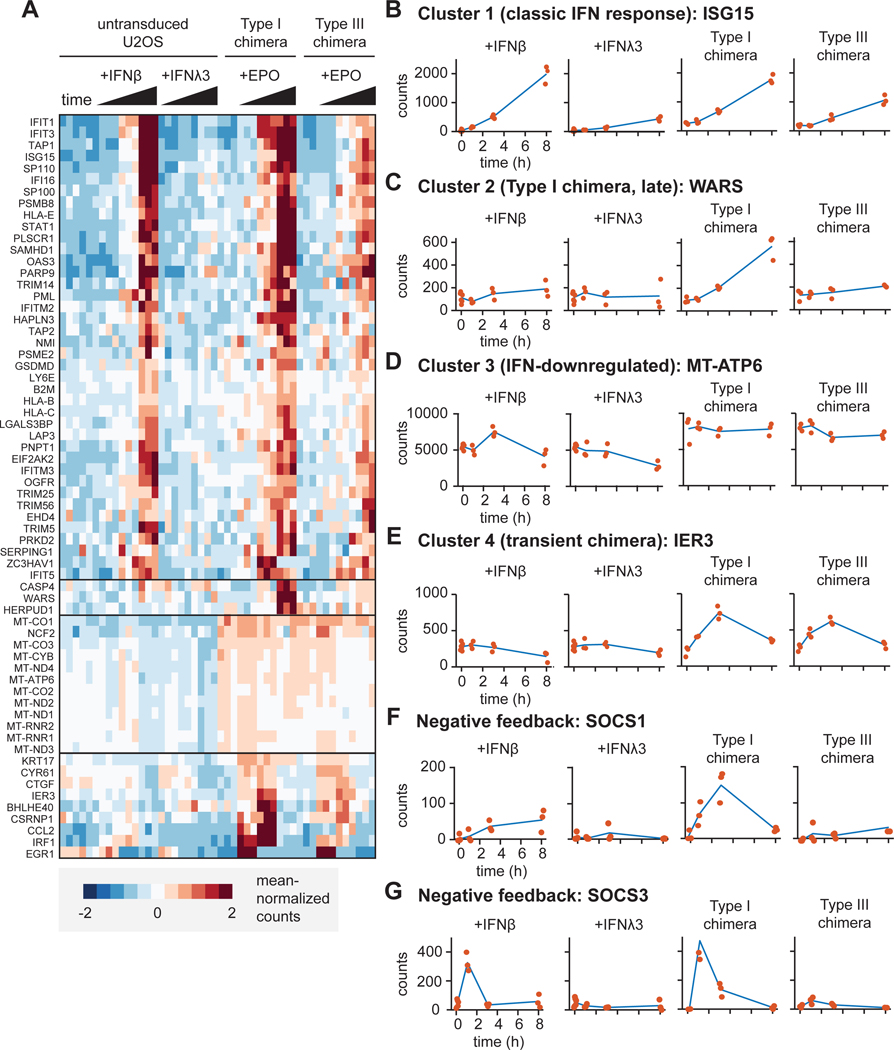
Fig. 4. RNA expression profiles differ between cells expressing chimeric type I and III IFN receptors.
(A to G) Bulk RNA-seq analysis was performed on RNA extracted from naïve U2OS cells treated with IFN-β (1000 IU/ml) or IFN-λ3 (100 ng/ml) and cells expressing chimeric type I or III IFN receptors treated with EPO (100 ng/ml) for the indicated times. Data includes three replicates for each condition. (A) Heat-map showing clustered gene expression patterns for 64 differentially expressed genes. Solid black horizontal lines indicate different clusters. (B) Cluster 1 genes were defined by their time-dependent induction in response to endogenous and chimeric IFN receptor signaling. (C) Cluster 2 genes were defined by being induced at 8 hours by the chimeric type I IFN receptor only. (D) Cluster 3 genes were defined by their time-dependent decreased expression in response to endogenous IFN receptors, but not chimeric IFN receptors. (E) Cluster 4 genes were defined by their transient induction by chimeric IFN receptors, but not endogenous IFN receptors. (B to E) The expression patterns of representative genes are shown for each cluster. Red dots indicate individual data points. (F) SOCS1 expression over time. (G) SOCS3 expression over time. The type I chimera consists of EPORhet-IFNAR2 paired with EPORM150E-IFNAR1, whereas the type III chimera consists of EPORhet-IFNLR1 paired with EPORM150E-IL10RB. ISG15, interferon-stimulated gene 15; WARS, tryptophanyl-tRNA synthetase; MT-ATP6, mitochondrially encoded ATP synthase 6; IER3, immediate early response 3; SOCS1, suppressor of cytokine signaling 1; SOCS3, suppressor of cytokine signaling 3.

