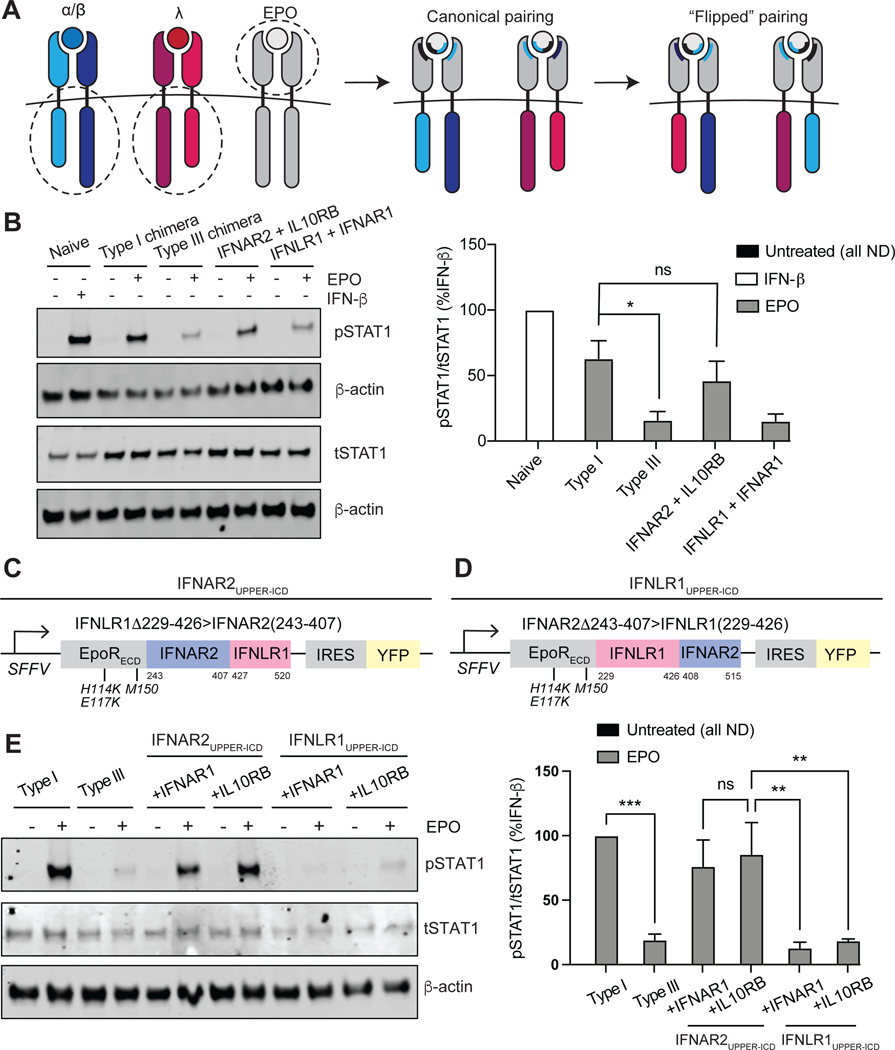
Fig. 6. The membrane-proximal half of the IFNAR2 ICD is necessary for chimeric type I IFN receptor signaling strength.
(A) Schematic illustrating noncanonical, “flipped” chimeric pairings: EPORhet-IFNAR2 paired with EPORM150E-IL10RB; EPORhet-IFNLR1 paired with EPORM150E-IFNAR1. The ECDs of EPORM150E-IFNAR1 and EPORM150E-IL10RB contain the point mutation M150E, whereas the ECDs of EPORhet-IFNAR2 and EPORhet-IFNLR1 contain the three point mutations H114K, E117K, and M150E. All chimeras were expressed under an SFFV promoter and contained an IRES for concurrent expression of either BFP or YFP. (B) Left: U2OS cells expressing the canonical and noncanonical chimeric subunit pairings at similar abundances were treated with EPO (100 ng/ml) for 30 min and analyzed by Western blotting for phosphorylated and total STAT1. β-actin was used as a loading control. Naïve U2OS cells treated with IFN-β (1000 IU/ml) for 30 min were included as a positive control. Western blots are representative of three independent experiments. Right: The relative abundances of pSTAT1 to tSTAT1 in the indicated samples from three independent experiments were determined by densitometry analysis and are expressed as a percentage of the pSTAT1 abundance in IFN-β–treated naïve cells, which was set at 100%. (C) The “IFNAR2UPPER-ICD” triple chimera was generated by fusing the EPOR ECD (containing the mutations H114K, E117K, and M150E) to amino acid residues 243 to 407 of IFNAR2 and 427 to 520 of IFNLR1. (D) The “IFNLR1UPPER-ICD” triple chimera was generated by fusing the EPOR ECD (containing the mutations H114K, E117K, and M150E) to amino acid residues 229 to 426 of IFNLR1 and 408 to 515 of IFNAR2. (E) Left: U2OS cells were transduced to express equivalent amounts of the canonical IFN receptor chimeras (type I or III) or the “UPPER-ICD” chimeras paired with either EPORM150E-IFNAR1 or EPORM150E-IL10RB (each with the mutation M150E in EPOR). Cells were treated with EPO (100 ng/ml) for 30 min before being analyzed by Western blotting for pSTAT1 and tSTAT1. β-actin was used as a loading control. Western blots are representative of three independent experiments. Right: The relative abundances of pSTAT1 to tSTAT1 in the indicated samples of three independent experiments were determined by densitometry analysis and are expressed as a percentage of the pSTAT1 abundance in EPO-treated “type I” cells, which was set at 100%. *P < 0.05, **P < 0.01, ***P < 0.001; ns, not significant; ND, not detected.

