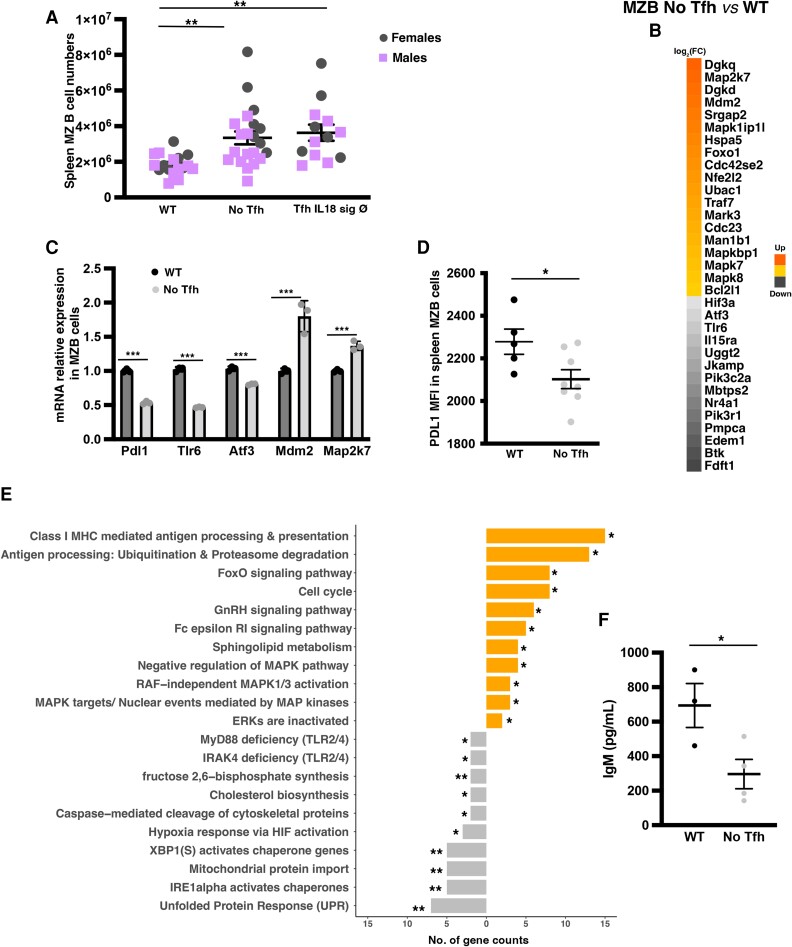
Figure 3.
Lack of Tfh cells leads to accumulation of ‘aberrant’ MZB cells. Data from the same experimental No Tfh and WT groups. (A) Total splenic MZB cells (n = 12–15 mice/group). (B, C, and E) MZB cell RNA-seq from No Tfh and WT groups (n = 5–6 mice/group). (B) Clustered heat map of 33 genes that were differentially expressed. (C) qRT-PCR for Pdl1 (n = 3 mice/group). (D) PDL1 surface expression by flow cytometry. (E) Selected significantly enriched GSEA pathways. Each bar represents the number of significantly expressed genes in each pathway. Orange denotes up- and grey downregulated in MZB cells from No Tfh vs. WT. (F) IgM levels in the supernatants of sorted MZB cells (n = 6–9 mice/group) after culture with CpG. Representative plot from two independent experiments with similar results. P < 0.05 (Student’s t-test) and P < 0.1 (Mann–Whitney). (A, C, D, and F) Student’s t-test and (E) Fisher’s exact test. *P < 0.05, **P < 0.01, and ***P < 0.001.

