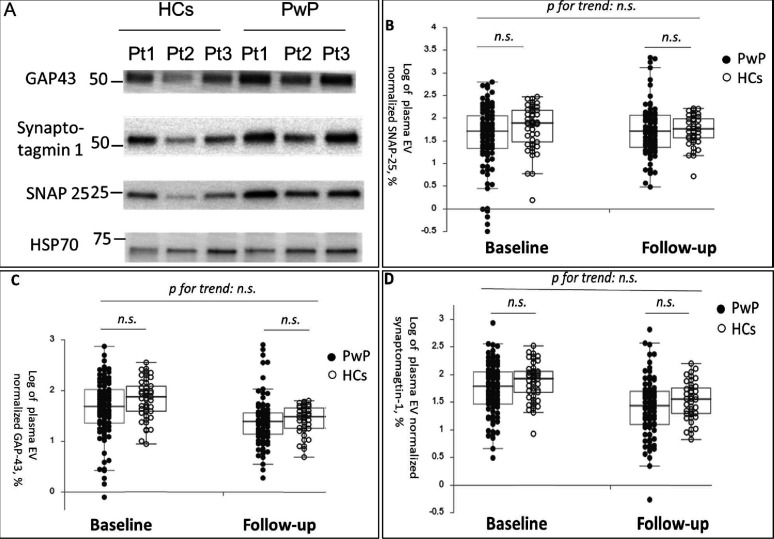
Figure 1. Baseline and follow-up synaptic protein levels in plasma extracellular vesicles (EVs) between patients with Parkinson’s disease (PwP) and healthy controls (HCs).
(A) Representative protein blot images of different synaptic proteins, including SNAP-25, GAP-43, and synaptotagmin-1. Heat shock protein 70 (HSP-70) was the protein loading control. (B–D) Comparison of plasma SNAP-25, GAP-43, and synaptotagmin-1 levels between PwP and HCs at baseline and follow-up. Data are presented using a dot plot displaying the median and first and third quartile values. n.s., nonsignificant.

