
Figure 1. Untargeted retinal lipidomic analysis in bacterial endophthalmitis.
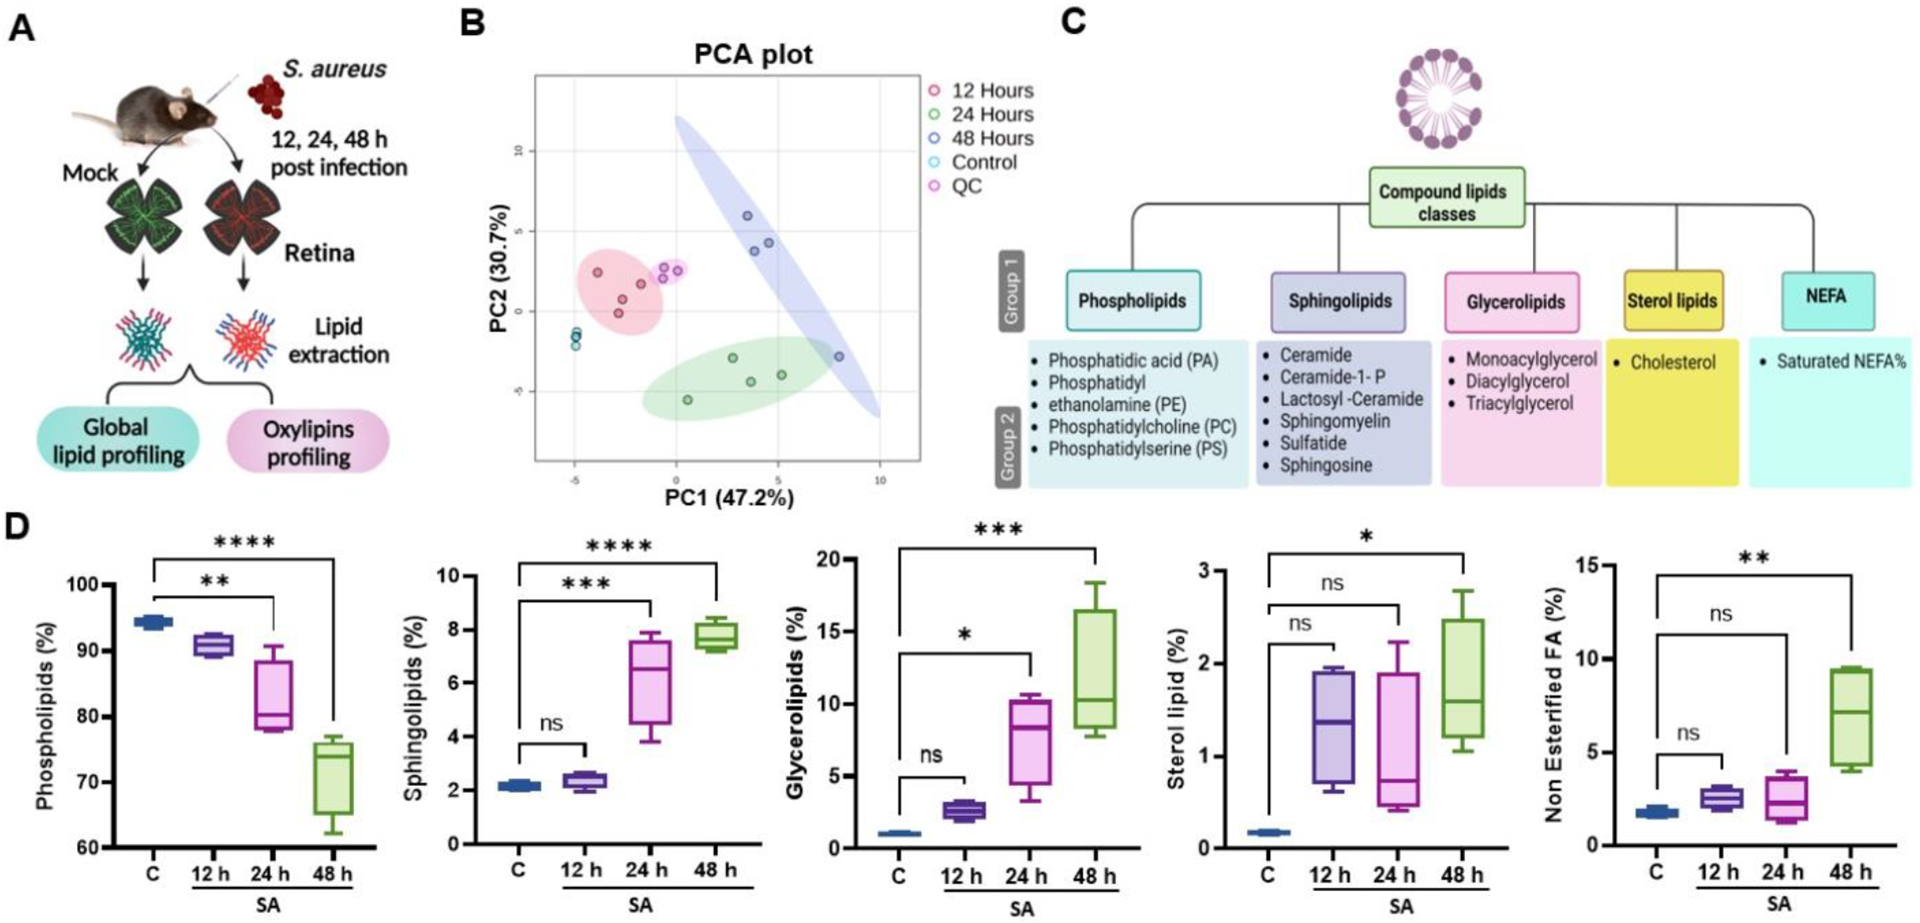
(A) Schematic of experimental design for lipidomic analysis in bacterial endophthalmitis. Retinal tissue from uninfected (mock) or S. aureus (SA)-infected eyes (n=4) at three different time points (12, 24 or 48 h) were used for lipidomic analysis. (B) Principal component analysis (PCA) of untargeted lipidomic data shows distinct clustering of various experimental groups at different time intervals with QC (Quality control). (C) Schematic of the lipid classification used in this study indicating five major lipid classes and their subclasses and species. (D) Lipidomic analysis showing temporal percentage changes in the mock (c) versus SA-infected retinal tissue. Statistical analysis was performed using one-way ANOVA, with significance levels of (*) p<0.05, (**) p<0.01, (***) p<0.001, (****) p<0.0001, ns indicating non-significance. Comparisons were made between uninfected control (C) vs. SA-infected retina.