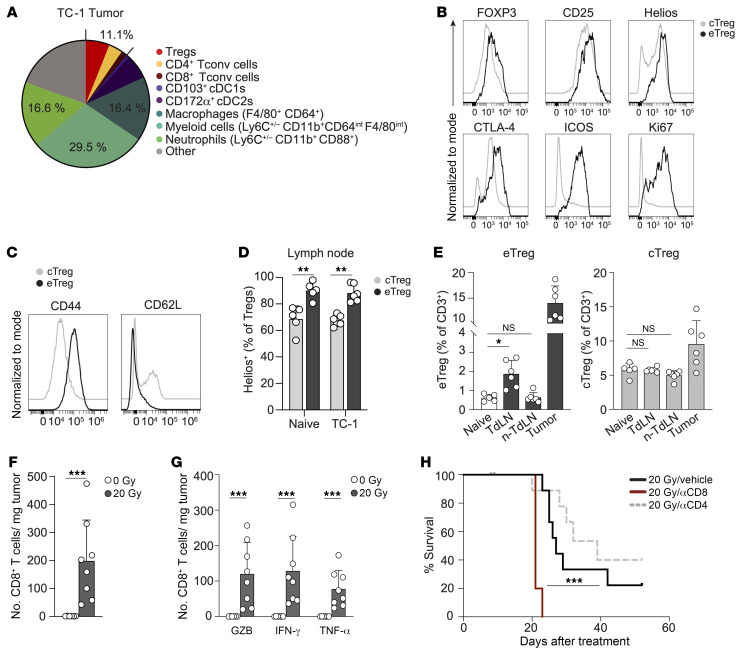
Figure 2. Myeloid cell– and Treg-rich TC-1 tumor shows a CD8+ T cell–dependent RT response.
(A) Frequency of the indicated immune cell populations among CD45+ cells measured by flow cytometry in 50 mm2 TC-1 tumors (n = 6). (B–D) cTregs and eTregs were defined as indicated in Supplemental Figure 2, B–D, and identified in the TdLN, non-TdLN, and tumor of 100 mm2 TC-1 tumor–bearing mice (n = 6) and age-matched naive (non-tumor-bearing) mice (n = 5). FlowSOM-guided clustering was performed on 5,000 randomly selected cells per sample within the CD3+ lymphocyte population. (B and C) Representative histograms depicting expression of the indicated markers on cTreg and eTreg populations in axillary LNs of naive and TC-1 tumor–bearing mice. (D) Frequency of Helios+ cells among cTregs and eTregs in axillary LNs of naive and TC-1 tumor–bearing mice. (E) Percentage of eTregs (left) and cTregs (right) among CD3+ T cells in the indicated tissues. (F–H) Monitoring by flow cytometry of the CD8+ T cell response to 20 Gy RT (n = 8) or control (0 Gy, n = 6) in TC-1 tumors. n-TdLN, non-TdLN. (F) Absolute number of total CD8+ T cells and (G) GZB-, IFN-γ–, or TNF-α–expressing CD8+ T cells per milligram of tumor tissue on after post-RT day 8. IFN-γ and TNF-α levels were measured after in vitro PMA/ionomycin stimulation. (H) OS of TC-1 tumor–bearing mice treated with 20 Gy RT on day 0 in combination with vehicle (PBS, n = 9) or depleting mAbs specific for CD8 (n = 5) or CD4 (n = 9). αCD8, anti-CD8 mAb. ***P < 0.001 (Mantel-Cox analysis). Data are from 1 experiment and are representative of at least 2 experiments. Error bars indicate the SD. *P < 0.05, **P < 0.01, and ***P < 0.001, by Kruskal-Wallis test with uncorrected Dunn’s post hoc analysis (E) and Mann-Whitney U test (D, F, and G).

