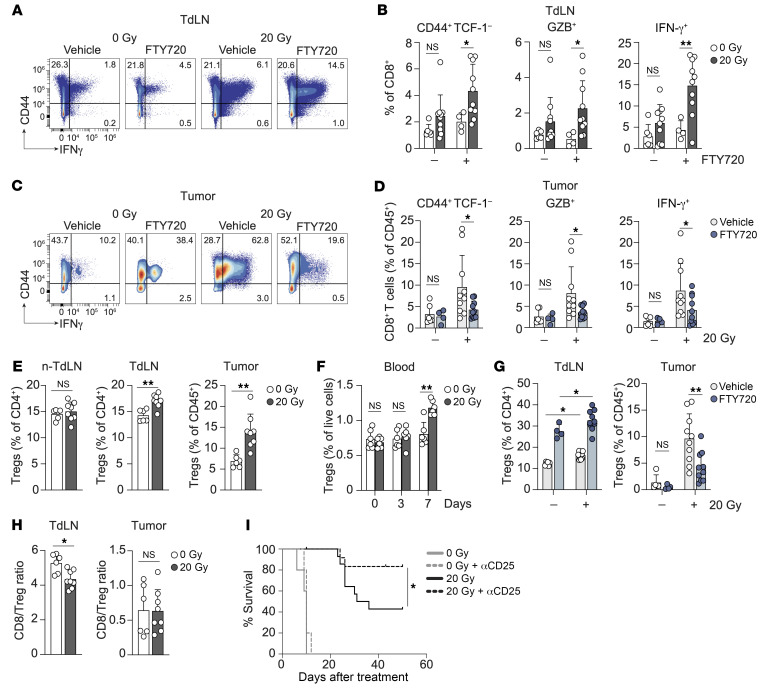
Figure 3. RT induces concomitant CTL and Treg responses in the TC-1 tumor model.
(A–D) TC-1 tumor–bearing mice were treated with 20 Gy RT (n = 10) or control (0 Gy, n = 4–6) when tumors reached approximately 20 mm2 in size (day 0). FTY720 or vehicle (NaCl) was administered orally on days –1, 3, and 5. On day 8, the CD8+ T cell response was analyzed by flow cytometry in the TdLN (A and B) and tumor (C and D). (A and C) Representative concatenated flow cytometric plots showing IFN-γ+ cells among CD8+ T cells in the TdLN (A) and tumor (C). (B and D) Frequency of CD44+TCF-1–, GZB+, and IFN-γ+ cells among CD8+ T cells in the TdLN (B) and tumor (D). IFN-γ was measured after in vitro PMA/Ionomycin stimulation. (E and F) Monitoring of the (FOXP3+CD25+) Treg response to 20 Gy RT (n = 6–8) or control (0 Gy, n = 6) in TC-1 tumor–bearing mice on day 8 after treatment. (E) Treg frequency among CD4+ T cells in the non-TdLN and TdLN, or among CD45+ cells within the tumor. (F) Percentage of Tregs among live cells in blood at the indicated time points (n = 6/group). (G) Frequency of Tregs in the indicated tissues on day 8 following 20 Gy RT (n = 10) or control (0 Gy, n = 4–6) with or without FTY720 treatment. (H) CD8+ T cell/Treg ratio in the TdLN and tumor after RT. (I) OS of TC-1 tumor–bearing mice treated with 0 Gy (n = 5) or 20 Gy (n = 11–14/group) RT in combination with a CD25-depleting mAb or vehicle (PBS) administered i.p. on day –1 and on day 5 after RT. *P < 0.05 (Mantel-Cox analysis). Data are from 1 experiment and are representative of at least 2 experiments. Error bars indicate the SD. *P < 0.05 and **P < 0.01, by 2-way ANOVA with Bonferroni’s post hoc test (B, D, F and G) and Mann-Whitney U test (E and H).

