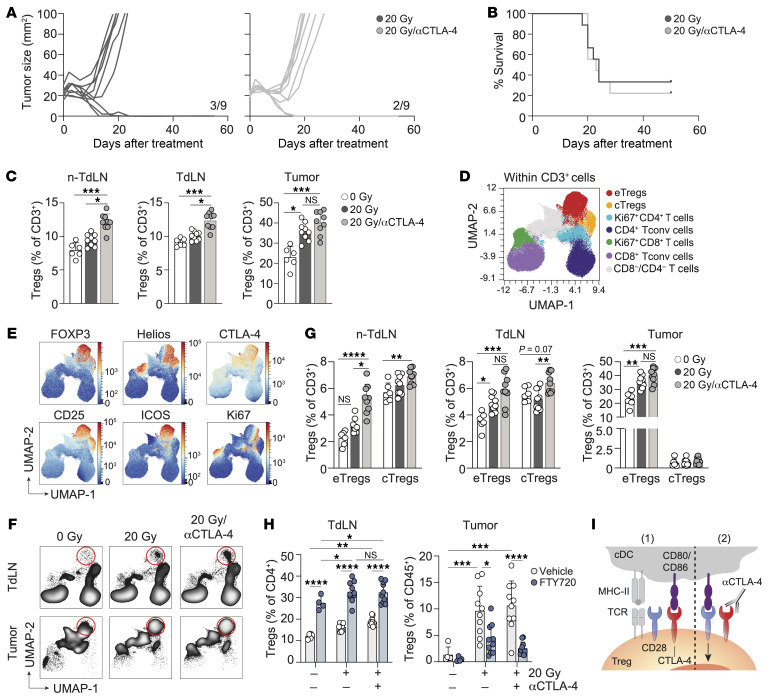
Figure 4. CTLA-4 blockade exacerbates RT-induced eTreg expansion.
Mice bearing 20 mm2 TC-1 tumors received RT (20 Gy, n = 9) or control (0 Gy, n = 6) on day 0. Treatment included vehicle (PBS) or a CTLA-4–blocking mAb on days 0, 3, 6, and 9, with longitudinal monitoring (A and B) and flow cytometric analysis of the non-TdLN, TdLN, and tumor on post-treatment day 8 (C–G). (A) Individual tumor growth curves and (B) OS for the treatment groups. Ratios indicate the number of mice that showed full recovery upon treatment compared with the total. (C) Percentage of total Tregs among CD3+ lymphocytes in the indicated tissues on day 8. (D–F) UMAP display of 2,500 randomly selected CD3+ T cells per sample in non-TdLN, TdLN, and tumor on day 8 for all treatment groups combined, with FlowSOM-guided clustering (see also Supplemental Figure 2B) (D) and marker visualization (E) used to highlight the eTreg response. (F) UMAP visualization of the response of the CD3+ T cell subpopulations in the TdLN and tumor to the indicated treatments. Red circles highlight the eTreg population. (G) Frequencies of eTregs and cTregs identified in D among CD3+ T cells found in the indicated tissues on post-treatment day 8. (H) TC-1 tumor–bearing mice received 20 Gy (n = 10/group) or control (0 Gy, n = 4–6), with CTLA-4 mAb blockade or vehicle on days 0, 3, and 6, with or without FTY720. Treg frequencies were measured in the TdLN and tumor on post-RT day 8 (same experiment as in Figure 3G). (I) Visual representation of how Tregs benefit from CTLA-4 blockade. Data are from 1 experiment and are representative of 2 experiments. Error bars indicate the SD. *P < 0.05, **P < 0.01, ***P < 0.001, and ****P < 0.0001, by Kruskal-Wallis with Dunn’s post hoc test (C and G) and 2-way ANOVA with Tukey’s multiple-comparison test (H).

