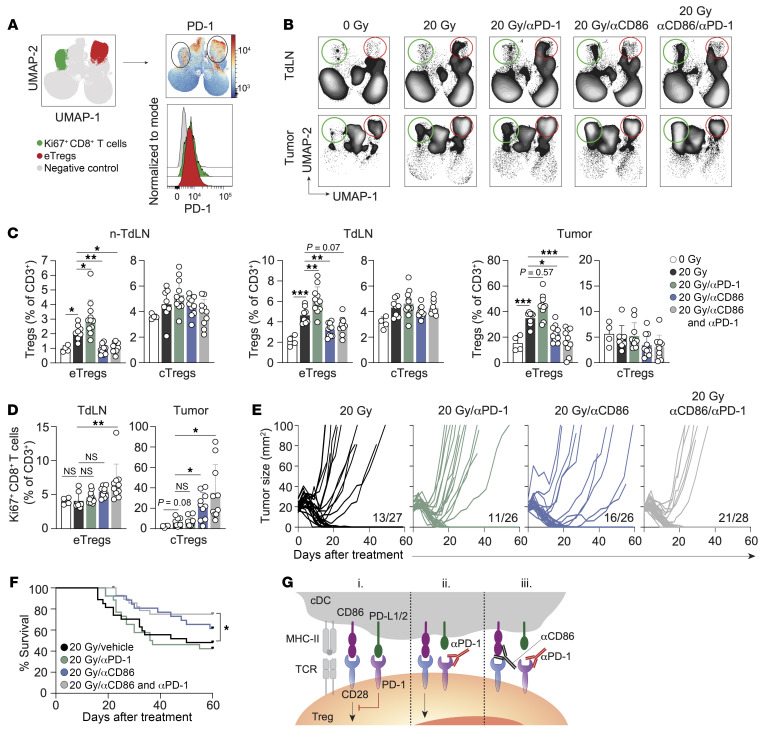
Figure 7. CD86-mediated CD28 costimulation is required for PD-1–dependent eTreg expansion.
(A) PD-1 expression on Ki67+CD8+ T cells (green) and eTregs (red) in the tumor as identified in Figure 5A, presented as a heatmap and a representative histogram across all experimental conditions. (B–D) TC-1 tumor–bearing mice received 0 Gy (n = 4) or 20 Gy RT on day 0 with vehicle (PBS, n = 8) or blocking mAbs against PD-1 (n = 11), CD86 (n = 10), or their combination (n = 10) on days 0, 3, and 6. CD3+ lymphocyte responses were analyzed by flow cytometry in non-TdLNs, TdLNs, and tumor on day 8. (B) UMAP visualization of the treatment response of the CD3+ T cell subpopulations. The red circle indicates eTregs, and the green circle indicates Ki67+CD8+ T cells (see also Supplemental Figure 8, B and C). (C) Frequencies of eTregs and cTregs identified in Supplemental Figure 8B among CD3+ T cells in the indicated tissues. (D) Quantification of the Ki67+CD8+ T cell population among total CD3+ T cells in the TdLN and tumor. (E) Individual tumor growth curves and (F) OS of TC-1 tumor–bearing mice receiving RT on day 0 with vehicle (n = 27), blocking mAbs against PD-1 (n = 26), CD86 (n = 26), or a combination (n = 28) on days 0, 3, and 6. Proportion of mice that fully recovered is indicated. (G) Proposed effect of combined CD86 and PD-1 blockade on Tregs. (i) PD-L1/L2 on cDCs engages PD-1, which inhibits CD28 costimulation of Tregs. (ii) PD-1 blockade enables CD28 costimulation of Tregs. (iii) CD86 blockade inhibits CD28 costimulation of Tregs, which cannot be overruled by PD-1 blockade, impeding the Treg response. Data are from 1 experiment and are representative of 2 experiments. Error bars indicate the SD. *P < 0.05, **P < 0.01, and ***P < 0.001, by ordinary 1-way ANOVA with Dunnett’s post hoc test (C), Brown-Forsythe ANOVA with Dunnett’s T3 post hoc analysis (D), and Mantel-Cox analysis (F).

