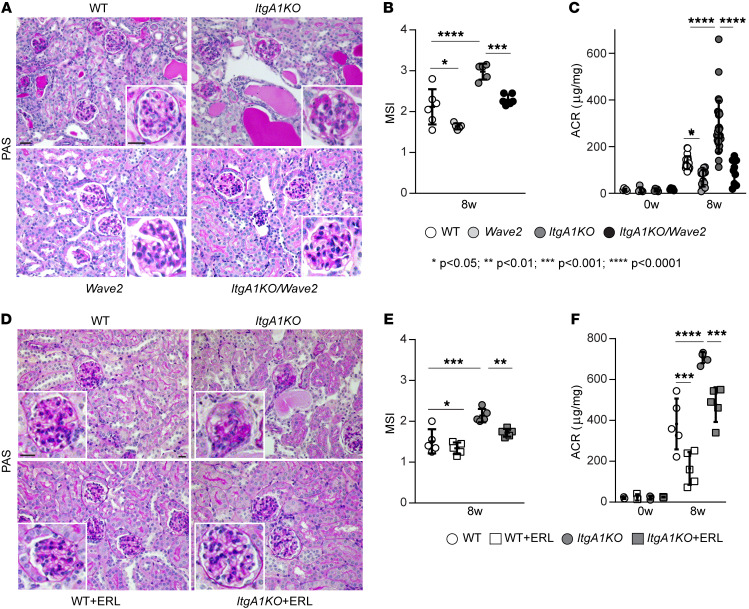
Figure 1. EGFR contributes to ADR-induced glomerular injury.
(A) Representative images of periodic acid–Schiff–stained kidney sections from WT, ItgA1KO, Wave2, and ItgA1KO/Wave2 mice treated with ADR for 8 weeks. Scale bars: 20 μm. (B) Mesangial sclerosis index (MSI) of kidneys shown in A was evaluated and scored as described in Methods. Values are the mean ± SD, and symbols represent individual kidneys (n = 6 WT, n = 5 ItgA1KO, n = 5 Wave2, n = 6 ItgA1KO/Wave2, with ~20 glomeruli per kidney evaluated). (C) Albumin/creatinine ratio (ACR) was evaluated at baseline (n = 5 WT, n = 5 ItgA1KO, n = 5 Wave2, n = 5 ItgA1KO/Wave2) and 8 weeks (n = 22 WT, n = 29 ItgA1KO, n = 15 Wave2, n = 10 ItgA1KO/Wave2) after ADR injection. Symbols represent individual mice. (D) Representative images of periodic acid–Schiff–stained kidneys from WT and ItgA1KO mice treated with ADR for 8 weeks and treated with vehicle or erlotinib (ERL). Scale bars: 20 μm. (E) MSI of kidneys shown in D was evaluated and scored as described in Methods. Values are the mean ± SD, and symbols represent individual kidneys (n = 5 WT, n = 5 ItgA1KO, n = 5 WT+ERL, n = 5 ItgA1KO+ERL, with ~20 glomeruli per kidney). (F) ACR was evaluated at baseline (n = 3 WT, n = 3 ItgA1KO, n = 3 WT+ERL, n = 3 ItgA1KO+ERL) and 8 weeks (n = 5 WT, n = 5 ItgA1KO, n = 5 WT+ERL, n = 5 ItgA1KO+ERL) after ADR injection. Symbols represent individual mice. Statistical analysis: 1-way ANOVA followed by Dunnett’s multiple-comparison test (B, C, E, and F).

