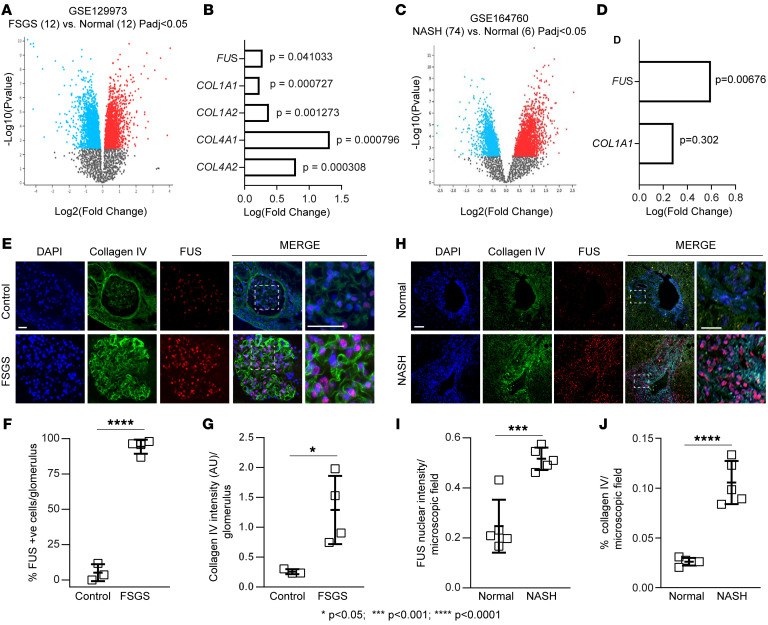
Figure 10. FUS mRNA is upregulated in kidneys and livers of individuals with kidney and liver disease.
(A) Volcano plot of differentially expressed mRNAs in 12 kidney biopsies of individuals with FSGS versus 12 healthy controls (Normal). Gray dots represent genes with no significant differences; blue dots represent downregulated genes, and red dots upregulated genes, with fold change >1.0 and P value <0.05. (B) Examples of fibrotic genes upregulated in individuals with FSGS with fold change >1.0 and P value <0.05. (C) Volcano plot of differentially expressed mRNAs in 74 liver biopsies of individuals with NASH versus 6 healthy controls (Normal). Gray, blue, and red dots represent gene changes as described in A. (D) Examples of fibrotic genes upregulated in individuals with NASH with fold change >1.0 and P value <0.05 (for FUS only). (E and H) Representative images of kidney and liver tissue samples from controls or individuals with FSGS or NASH costained with anti-FUS and anti–collagen IV antibodies. Scale bars: 25 μm. (F) The number of nuclear FUS-positive glomerular cells was calculated, and values are expressed as percentage FUS-positive cells per glomerulus. Values are the mean ± SD, and symbols represent individual kidneys (n = 3 normal, n = 4 FSGS, with 2–6 glomeruli analyzed per biopsy). (G) Collagen IV intensity per glomerulus was evaluated and expressed as described in Methods. Values are the mean ± SD, and symbols represent individual kidneys (n = 3 normal, n = 4 FSGS, with 2–6 glomeruli analyzed per biopsy). (I and J) Nuclear FUS intensity (I) or collagen IV intensity (J) per microscopic field was evaluated and expressed as described in Methods. Values are the mean ± SD, and symbols represent individual livers (n = 5 normal, n = 5 NASH, with an average of 3 microscopic fields analyzed per biopsy). Statistical analysis: unpaired 2-tailed t test (F, G, I, and J).

