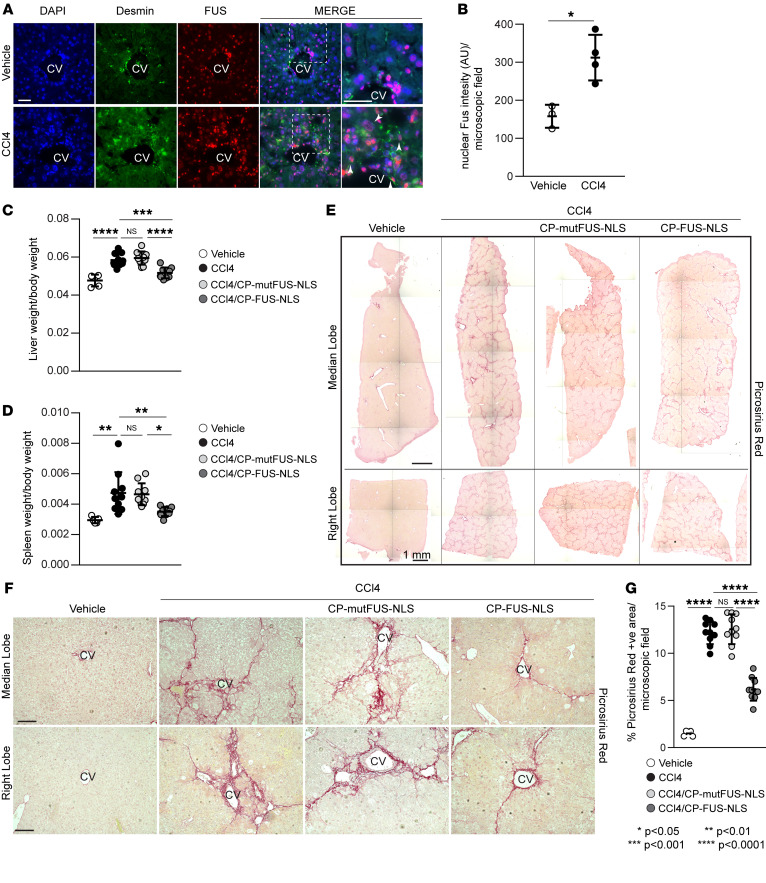
Figure 7. Pharmacologic inhibition of FUS nuclear translocation ameliorates CCl4-induced liver fibrosis.
(A) Representative images of liver sections from WT mice treated with CCl4 for 6 weeks stained for desmin (green), FUS (red), and DAPI (blue). CV, central vein. Arrowheads indicate desmin-positive cells. Scale bars: 20 μm. (B) Nuclear FUS intensity per microscopic field was calculated using ImageJ. Values are the mean ± SD, and symbols represent individual livers (n = 3 vehicle, n = 4 CCl4, with an average of at least 120 cells per microscopic field per liver). (C and D) Liver/body weight and spleen/body weight ratios in uninjured (vehicle) mice and mice treated for 6 weeks with CCl4 alone or in combination with CP-mut-FUS-NLS or CP-FUS-NLS. Values are the mean ± SD, and symbols represent individual livers or spleens (n = 5 vehicle, n = 10 CCl4, n = 10 CCl4+CP-mutFUS-NLS, n = 10 CCl4+CP-FUS-NLS). (E) Reconstruction of histologic images of median and right lobes of livers from the mice described in C stained with Picrosirius red staining. Scale bars: 1 mm. (F) Representative images of Picrosirius red–stained liver median and right lobes. Scale bars: 30 μm. (G) The amount of fibrillar collagen was evaluated using ImageJ software as described in Methods. Values are the mean ± SD, and symbols represent individual livers (n = 5 vehicle, n = 10 CCl4, n = 10 CCl4+CP-mutFUS-NLS, n = 10 CCl4+CP-FUS-NLS, with an average of at least 5 microscopic fields per lobe). Statistical analysis: unpaired 2-tailed t test (B); 1-way ANOVA followed by Dunnett’s multiple-comparison test (C, D, and G).

