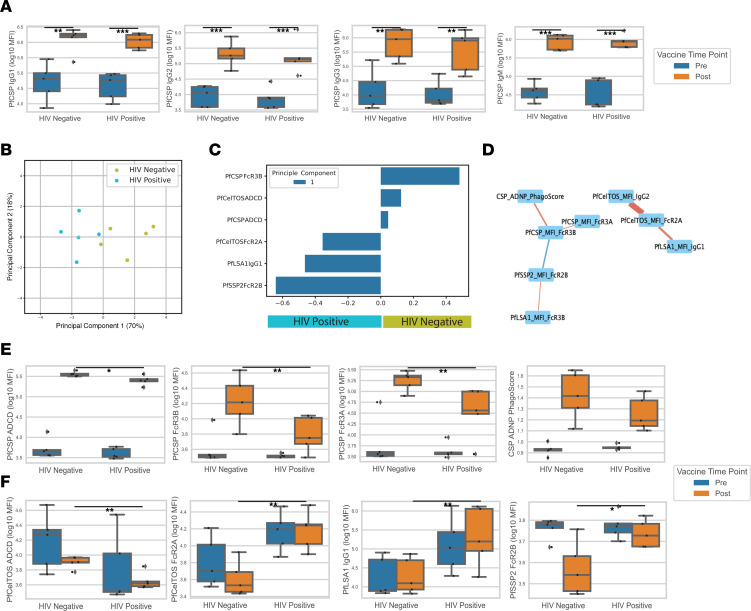
Figure 6. Systems serology analysis.
(A) Box plots of PfCSP isotype and levels of IgG1, IgG2, IgG3, and IgM in prevaccination (blue) and postvaccination (orange) samples for HIV– and HIV+ vaccinees. (B) PCA plot of postvaccination HIV+ (cyan) and HIV– (green) participants based on the elastic-net selected features (α = 0.75). Principle component 1 explained 70% of the variation observed. (C) Bar plot of the loadings for PC1. Features with a positive value were enriched in HIV– individuals, and features with a negative value were enriched in HIV+ individuals. (D) Elastic-net selected features cocorrelation network. All measured features that had a Spearman’s r > 0.5 and P < 0.2 with 1 of the selected features was included in this network plot. The color of an edge connotes the direction of correlation (red edge = +; blue edge = –), and the width of an edge connotes the significance of the relationship (wide edge = more significant; thin edge = less significant). (E) Box plots of CSP elastic-net selected and cocorrelated features from C and D of prevaccination (blue) and postvaccination (orange) samples for HIV– and HIV+ vaccinees. (F) Box plots of elastic-net of non-CSP antibody features of prevaccination (blue) and postvaccination (orange) samples for HIV– and HIV+ vaccinees. Mann-Whitney U method was used for statistical testing (A, E, and F). *P < 0.1; **P < 0.05; *** P < 0.01.

