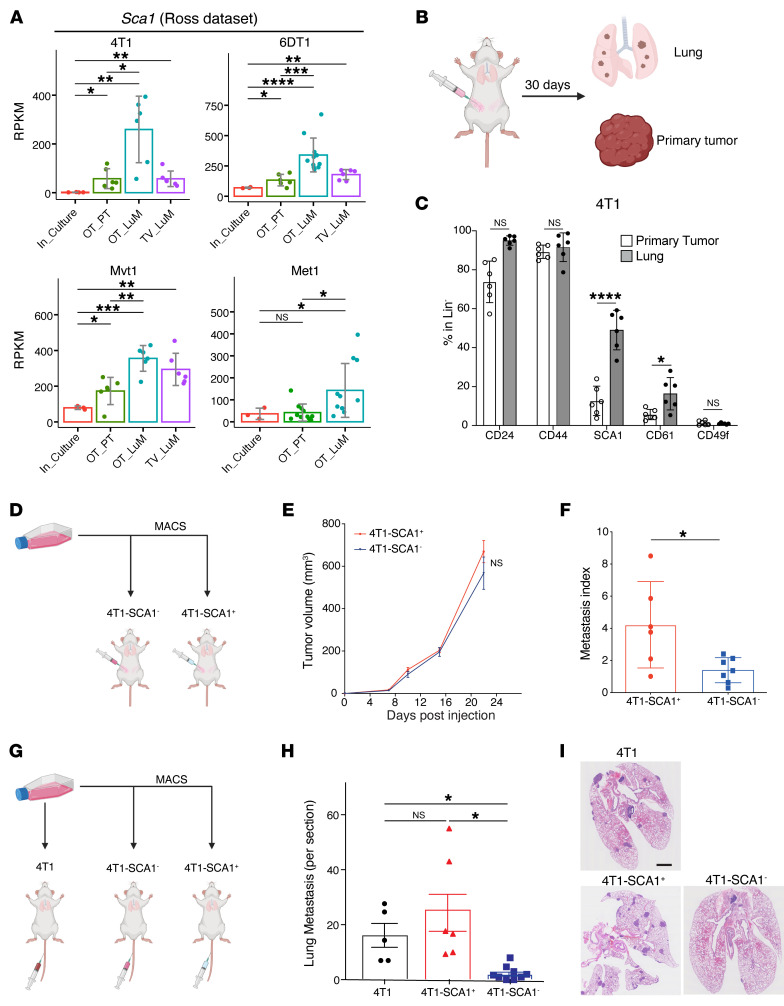
Figure 1. SCA1+ population is enriched during in vivo metastasis across multiple breast cancer models.
(A) Sca1 mRNA expression in the metastatic murine breast cancer models 4T1, 6DT1, Mvt1, and Met1, extracted from the Ross data set (39). Analyzed samples consist of cultured cells (In_Culture), orthotopic injected PTs (OP_PT), spontaneous lung metastases (OP_LuM), and lung metastases induced by i.v. injection (TV_LuM). Data are represented as the mean of reads per kilobase of transcript per million mapped reads (RPKM) ± SD. (B) Experimental setup for in vivo experimental validation. 4T1 tumor cells were orthotopically injected into the fourth mammary fat pad. Thirty days later, cells from PTs and lungs were isolated to examine CSC marker expression by flow cytometry. (C) Frequency of CSC marker expression in PTs and lung metastases. Results are shown as percentages of CD24-, CD44-, SCA1-, CD61-, and CD49f-positive cells gated in lineage-negative cells (CD45–CD31–TER119–). n = 6/group. (D–F) Experimental setup (D) of the in vivo experiment to assess tumor growth (E) and lung metastatic ability (metastatic index) (F) of 4T1-SCA1+ and 4T1-SCA1– populations isolated from tumors induced by parental 4T1 cells orthotopically injected into the fourth mammary fat pads. Metastases are assessed 21 days after tumor cell injection. n = 8/group. (G–I) Experimental setup (G) of in vivo experiment to assess lung colonization capacity upon tail-vein injection of sorted parental 4T1, 4T1-SCA1+, and 4T1-SCA1– cells. Lung metastatic nodule numbers (H) and representative images (I) of lungs from mice 10 days after injection. n = 5–6/group. Scale bar: 1 mm. Data are represented as means ± SEM and are representative of 3 independent experiments for C, E, F, and H. P values were calculated using unpaired, 2-tailed Student’s t test with Holm’s correction (A); unpaired 2-tailed Student’s t test (C and F); 2-way ANOVA with Tukey’s multiple-comparison test (E); or 1-way ANOVA with Tukey’s multiple-comparison test (H). *P < 0.05; **P < 0.01; ***P < 0.001; ****P < 0.0001.

