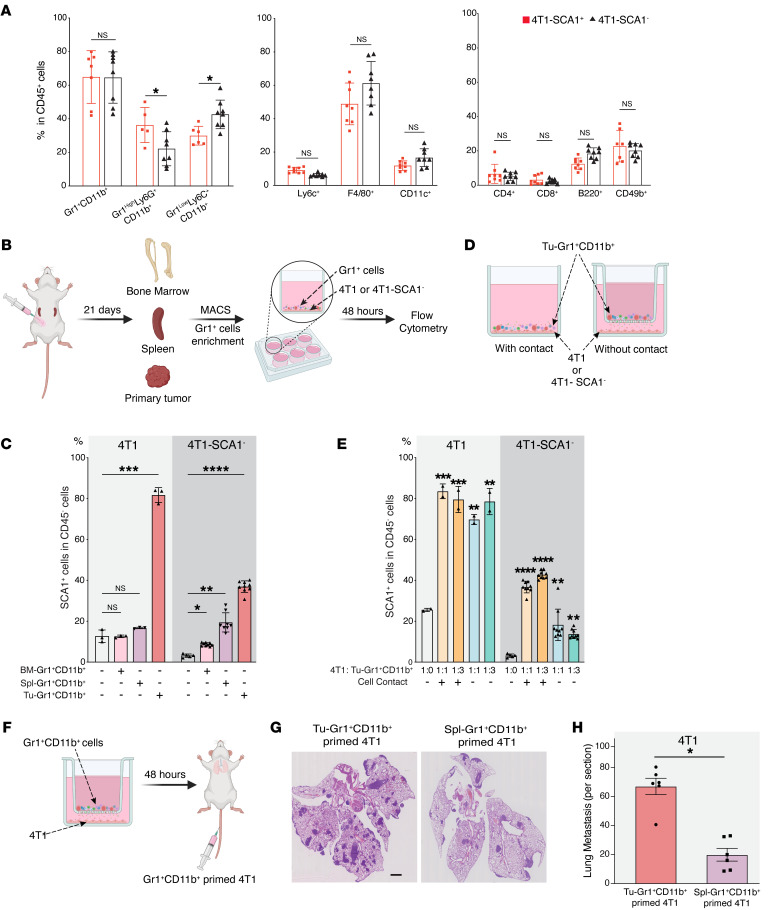
Figure 2. SCA1 expression is modulated by TME.
(A) Frequency of different immune cell populations in PTs of mice orthotopically injected with 4T1-SCA1+ and 4T1-SCA1– cells 21 days after injection. Populations are determined in CD45-positive, viable cells. n = 8 mice/group. (B and C) Schematic (B) showing experimental design for isolating Gr1+ cells from different sites of tumor-bearing mice. Twenty-one days after tumor implantation, Gr1+ cells were isolated from bone marrow (BM-Gr1+CD11b+), spleen (Spl- Gr1+CD11b+), or PT (Tu-Gr1+CD11b+) and cocultured for 48 hours with parental 4T1 or sorted 4T1-SCA1– cells in vitro. SCA1 expression in tumor cells was examined by flow cytometry (C). Coculture conditions are indicated in bar graph. n = 3/group for 4T1; n = 5–9/group for 4T1-SCA1–. (D and E) Schematic of experimental coculture setup (E). MACS-enriched Gr1+ cells were cocultured with 4T1 or sorted 4T1-SCA1– cells with or without Transwell inserts of 0.4 μm pore size. Cells were seeded in bottom well and Gr1+CD11b+ cells in upper part of insert. After 48 hours, tumor cells were examined for SCA1 expression by FACS (E). Coculture conditions are indicated in bar graph. Ratio of tumor cells and Tu-Gr1+CD11b+ varied from 1:1 to 1:3. n = 3/group for 4T1; n = 5–9/group for 4T1-SCA1–. (F–H) Schematic of experimental metastasis setup for evaluation of metastatic capacity of Gr1+CD11b+-educated 4T1 cells in vivo (F). 4T1 tumor cells were primed with Tu-Gr1+CD11b+ or Spl-Gr1+CD11b+ in vitro without cell-cell contact for 48 hours and injected into tail veins. Lung metastases were quantified 10 days after injection (G). Representative H&E staining images of lung sections are shown (H). Scale bar: 1 mm. n = 6 mice/group. Data are represented as means ± SEM and are representative of 3 independent experiments. P values were calculated using unpaired 2-tailed Student’s t test (A and H) or 1-way ANOVA with Dunnett’s multiple-comparison test (C and E). *P < 0.05; **P < 0.01; ***P < 0.001; ****P < 0.0001.

